Dubai Property Market H1 2026: The DLD Data Report
Dubai H1 2026 residential property data: 79,698 sales worth AED 227.1bn, with off-plan growth, ready-market decline, new projects and completions.
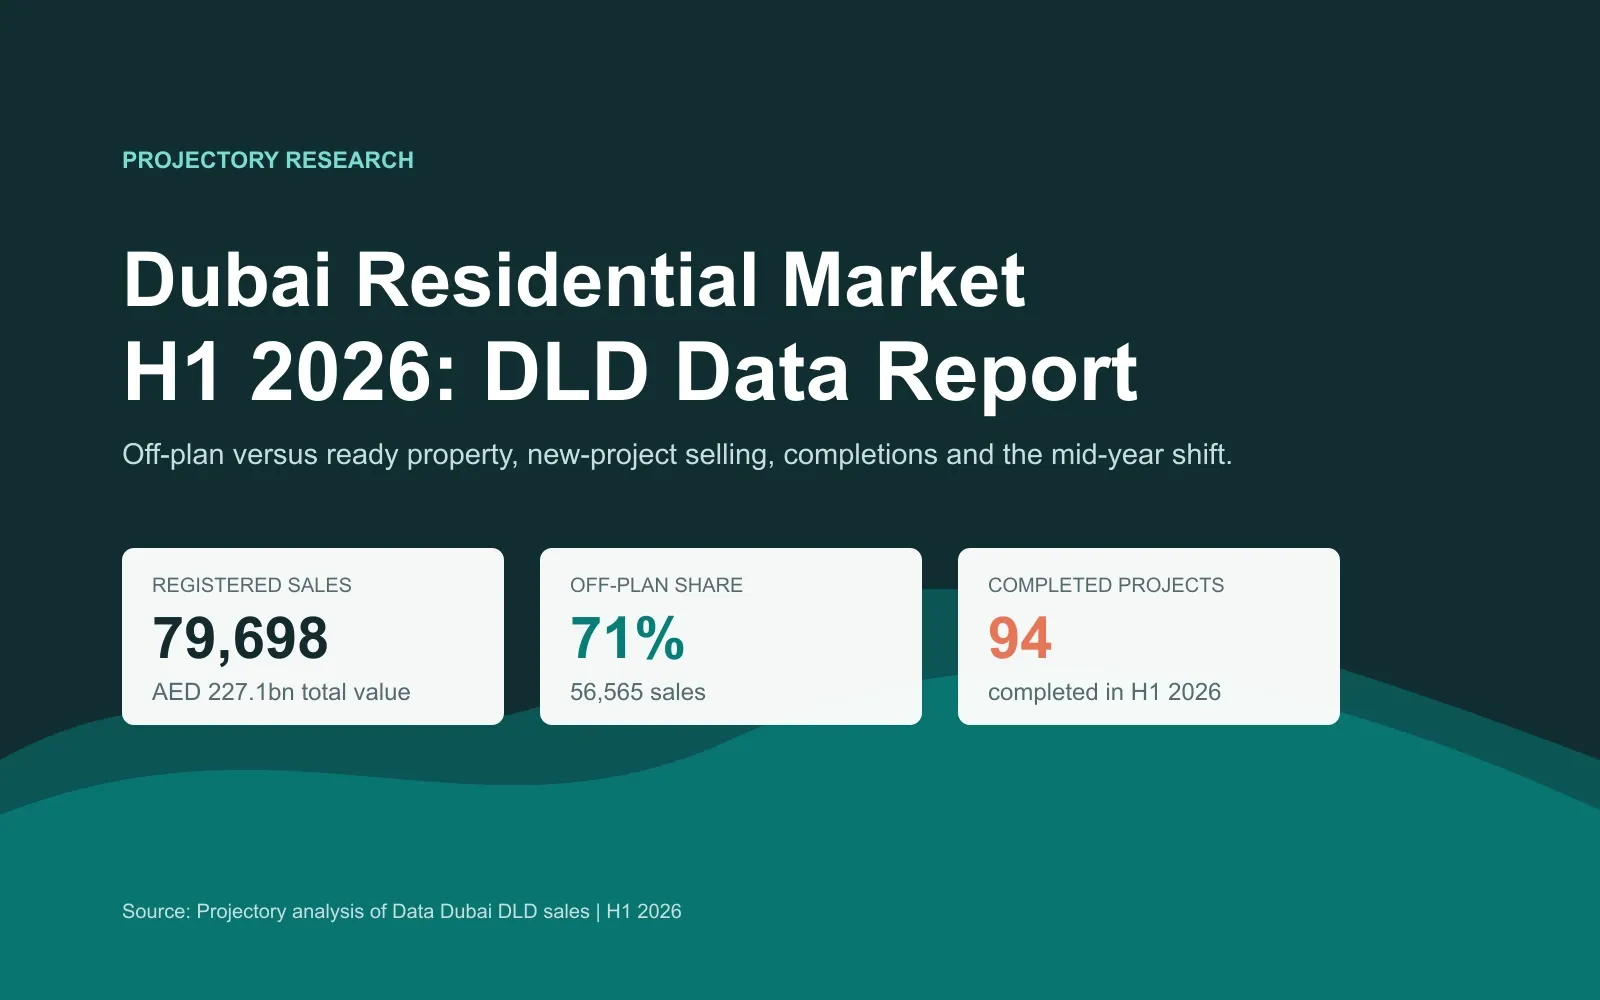
Dubai’s residential property market contracted during the first half of 2026, although the decline was far from uniform. Projectory’s current data, pulled directly from Data Dubai’s Dubai Land Department transaction records, contains 79,698 residential-market sales worth AED 227.1bn between 1 January and 30 June. Against H1 2025 processed through the same classification, sales fell 14.3% and value declined 16.0%.
The headline hides a large difference between homes and development transactions. Apartments, villas, townhouses and hotel apartments generated 75,746 sales, only 6.3% below H1 2025. Residential land and whole-building registrations fell 67.6% to 3,952.
Off-plan activity continued to grow. DLD recorded 56,565 off-plan sales, up 3.9% year on year, while ready-property sales fell 40.0% to 23,133. Buyers remained active in new developments even as the secondary market and residential development deals slowed sharply.
Regional conflict shaped the spring market alongside Ramadan, Eid, travel disruption and launch timing. Registrations reached their H1 low in May before rising 30.4% in June. Projectory’s Dubai off-plan market-demand analysis translates those shifts into buyer signals around area supply, payment plans and handover timing.
H1 2026 at a glance:
- Projectory’s DLD dataset contains 79,698 residential-market sales worth AED 227.1bn.
- 75,746 homes changed hands, down 6.3% against H1 2025.
- Residential land and whole-building registrations fell 67.6% to 3,952.
- Off-plan sales reached 56,565, an increase of 3.9%.
- Ready-property sales fell to 23,133, a decline of 40.0%.
- 226 projects recorded their first off-plan DLD sale during H1.
- According to DLD records, 94 projects with an H1 completion date were marked Finished and 100% complete, covering 44,643 properties.
Jump to:
- Off-plan growth continued as ready sales contracted
- Which developers led off-plan activity
- Home sales held up better than development transactions
- The spring slowdown and June recovery
- Where buyers spent by price band
- 226 projects recorded their first off-plan sales
- DLD records 94 project completions in H1
- The areas that led H1 sales
Off-plan growth continued as ready sales contracted
Dubai recorded 13,298 fewer residential-market sales than in H1 2025. Ready-property activity accounted for a fall of 15,438 sales, while off-plan added 2,140.
| Metric | H1 2025 | H1 2026 | Year-on-year change |
|---|---|---|---|
| Residential-market sales | 92,996 | 79,698 | -14.3% |
| Transaction value | AED 270.3bn | AED 227.1bn | -16.0% |
| Off-plan sales | 54,425 | 56,565 | +3.9% |
| Off-plan value | AED 121.2bn | AED 124.5bn | +2.8% |
| Ready-property sales | 38,571 | 23,133 | -40.0% |
| Ready-property value | AED 149.2bn | AED 102.6bn | -31.2% |
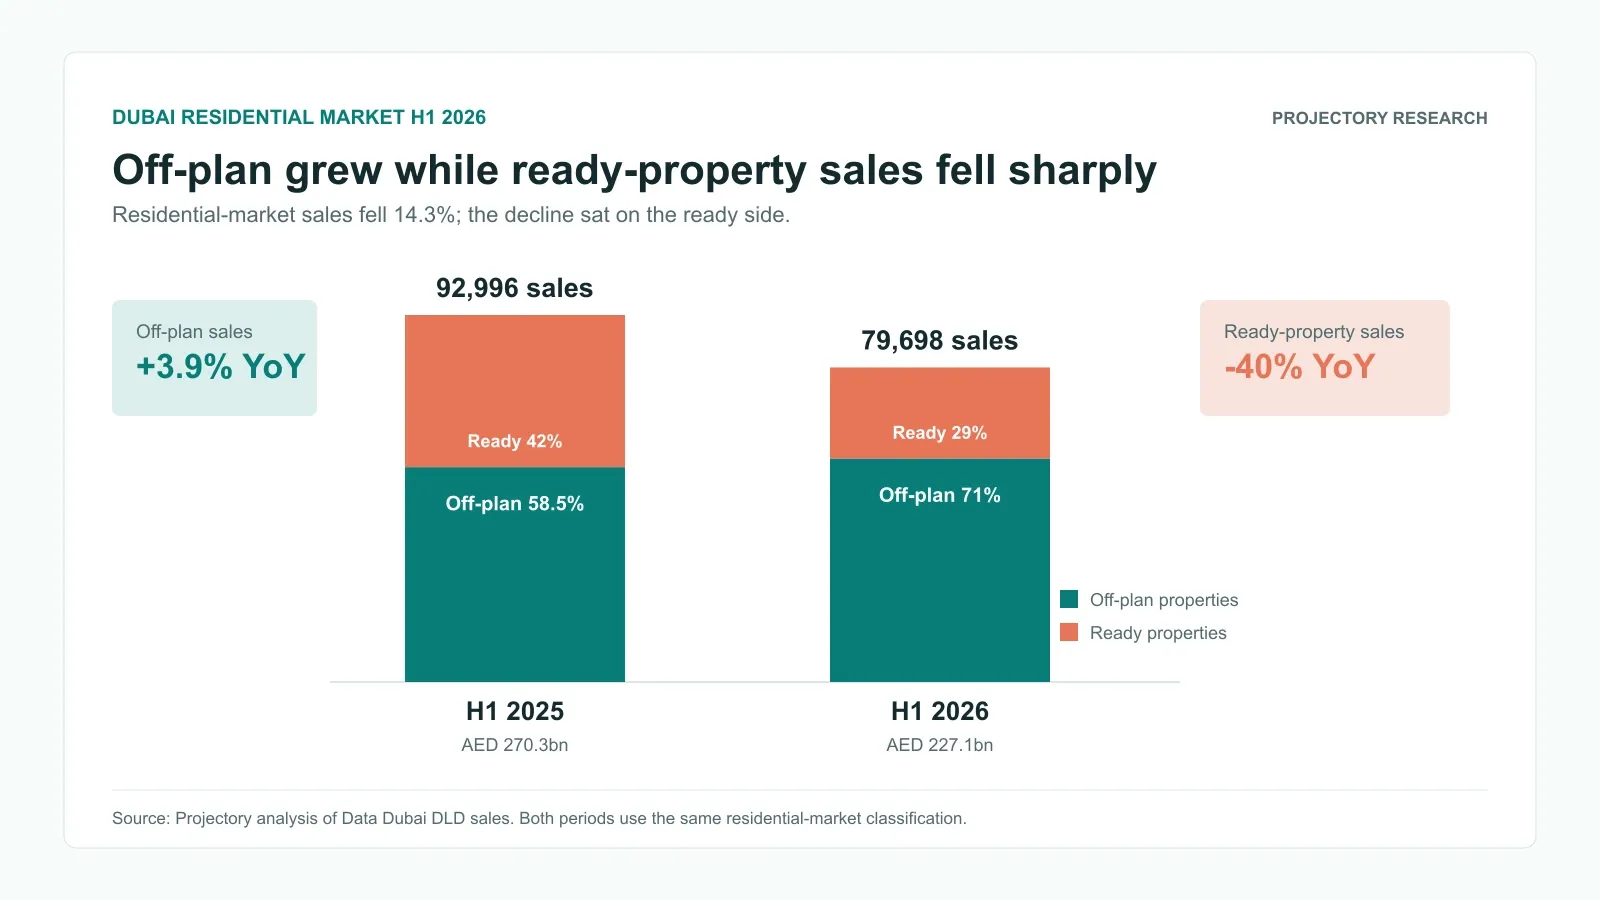
Off-plan’s share of sales rose from 58.5% to 71.0%. Its share of value increased from 44.8% to 54.8%.
Developers kept buyers engaged through new inventory and staged payment plans. Off-plan sales and value both increased even as the wider market contracted. The ready side faced a more selective buyer pool, larger immediate cash requirements and fewer residential land and whole-building deals.
Which developers led off-plan activity
Projectory’s analysis places Azizi Developments first for off-plan transaction volume in H1 2026, followed by DAMAC Properties, Binghatti, Emaar and Ellington Properties. Buyers comparing the companies behind those registrations can use Projectory’s UAE off-plan developer guide to assess track record, buyer fit and project-level checks.
| Rank | Developer | Off-plan registrations | Registered value |
|---|---|---|---|
| 1 | Azizi Developments | 6,101 | AED 5.3bn |
| 2 | DAMAC Properties | 5,610 | AED 14.6bn |
| 3 | Binghatti | 4,863 | AED 7.7bn |
| 4 | Emaar | 4,037 | AED 11.7bn |
| 5 | Ellington Properties | 2,380 | AED 6.7bn |
DAMAC led by registered value. Emaar ranked second, followed by Binghatti, Ellington Properties and Meraas.
| Rank | Developer | Registered value | Off-plan registrations |
|---|---|---|---|
| 1 | DAMAC Properties | AED 14.6bn | 5,610 |
| 2 | Emaar | AED 11.7bn | 4,037 |
| 3 | Binghatti | AED 7.7bn | 4,863 |
| 4 | Ellington Properties | AED 6.7bn | 2,380 |
| 5 | Meraas | AED 6.4bn | 1,075 |
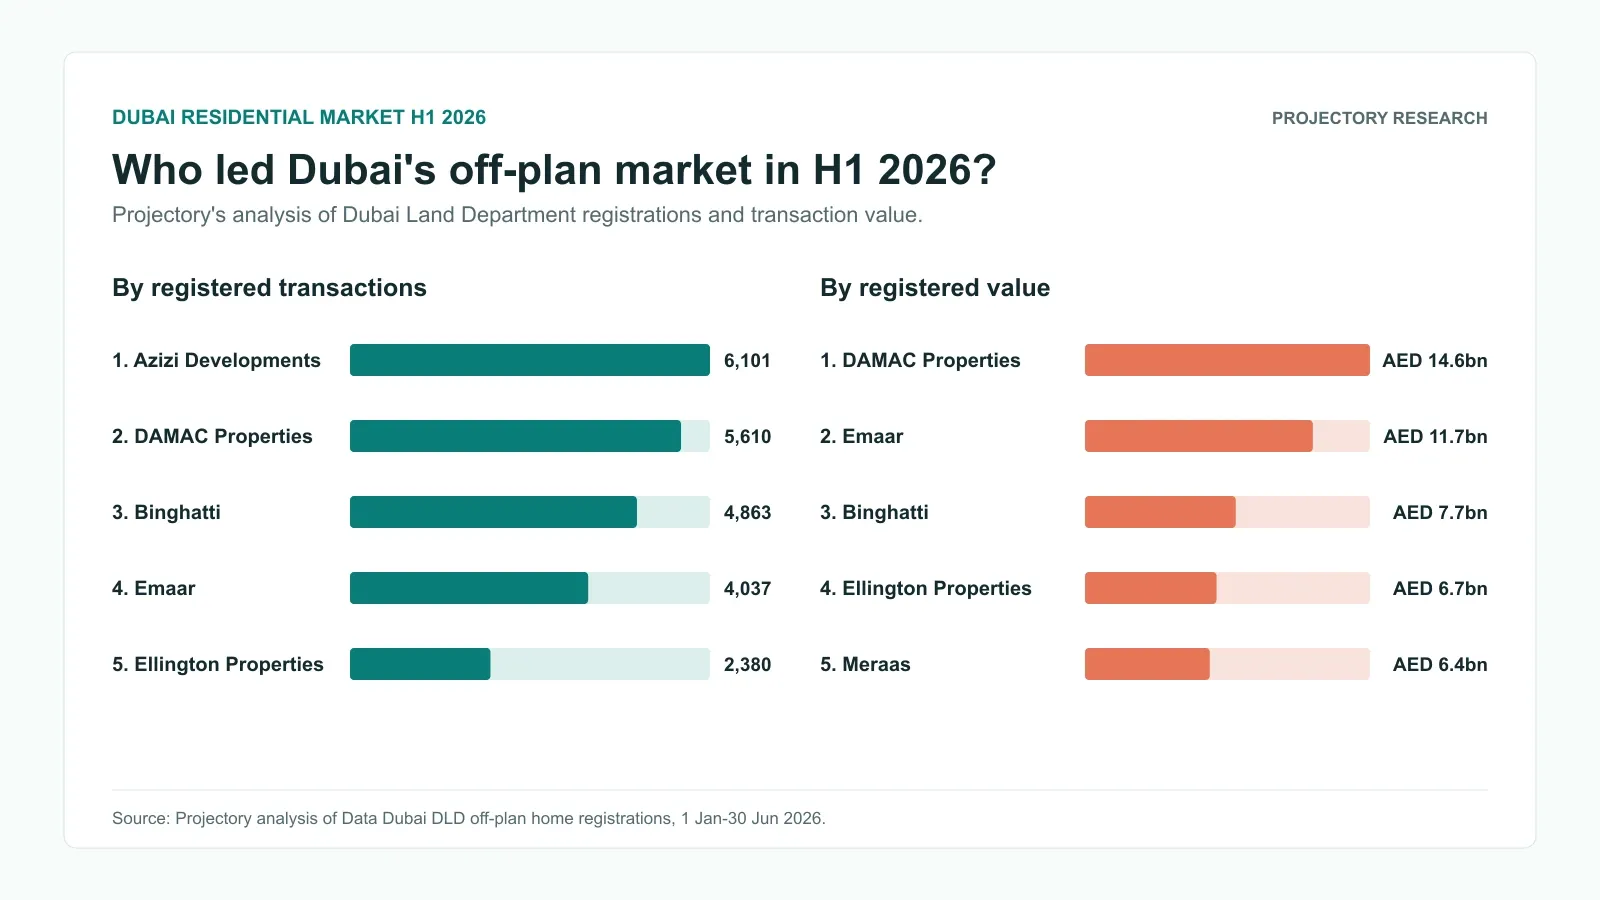
Note: DLD records each off-plan sale against the project. Some are first purchases from the developer, while others are homes resold by buyers before handover. The rankings show how active each developer’s projects were during H1.
Home sales held up better than development transactions
The residential headline combines two very different parts of the DLD register.
| Market segment | H1 2025 sales | H1 2026 sales | Change | H1 2026 value |
|---|---|---|---|---|
| Homes | 80,801 | 75,746 | -6.3% | AED 167.2bn |
| Residential land and whole buildings | 12,195 | 3,952 | -67.6% | AED 59.9bn |
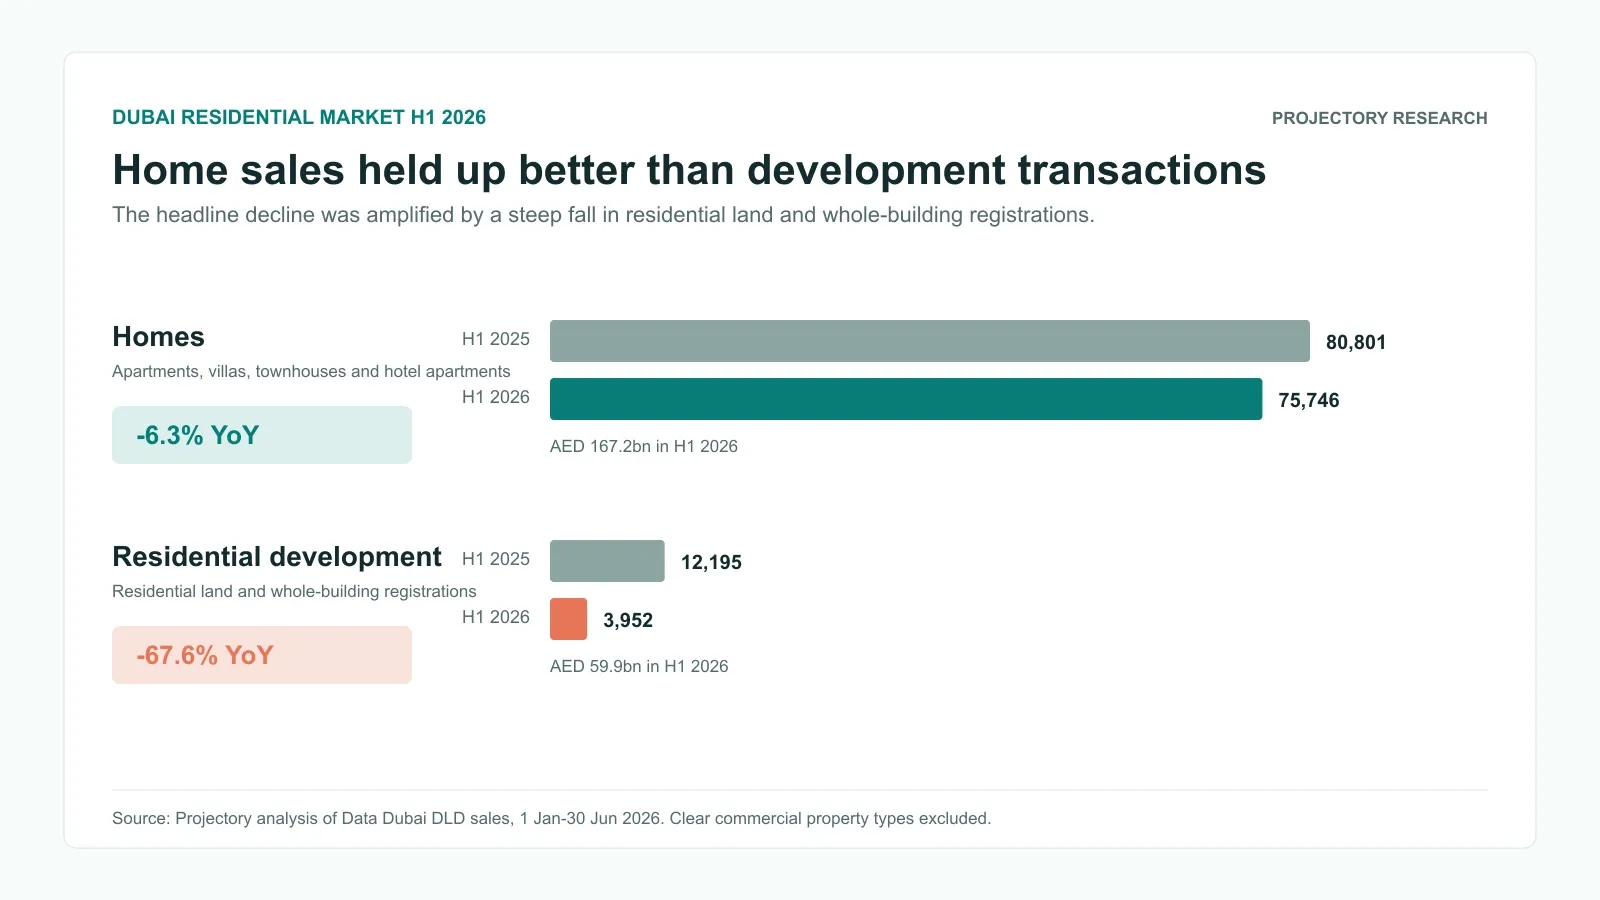
Home sales include apartments, villas, townhouses and hotel apartments. Their total value declined 7.1% to AED 167.2bn. Ready-home activity weakened, while off-plan home sales grew 3.9%.
Residential land and whole-building registrations produced the larger swing. Their sales count fell from 12,195 to 3,952, while value declined 33.6% from AED 90.3bn to AED 59.9bn. A smaller number of high-value development deals preserved more value than volume.
This split explains why experiences differed across the market. A broker selling new apartments saw continued demand. A landowner, building investor or ready-home seller faced a much quieter environment.
The spring slowdown and June recovery
DLD residential-market sales fell from 15,408 in February to 12,715 in March, a 17.5% monthly decline. Ready-property registrations dropped from 5,303 to 3,382 during the same period.
May marked the H1 low with 9,866 sales. June recovered to 12,865, up 30.4% in one month. Activity still finished 18.1% below June 2025.
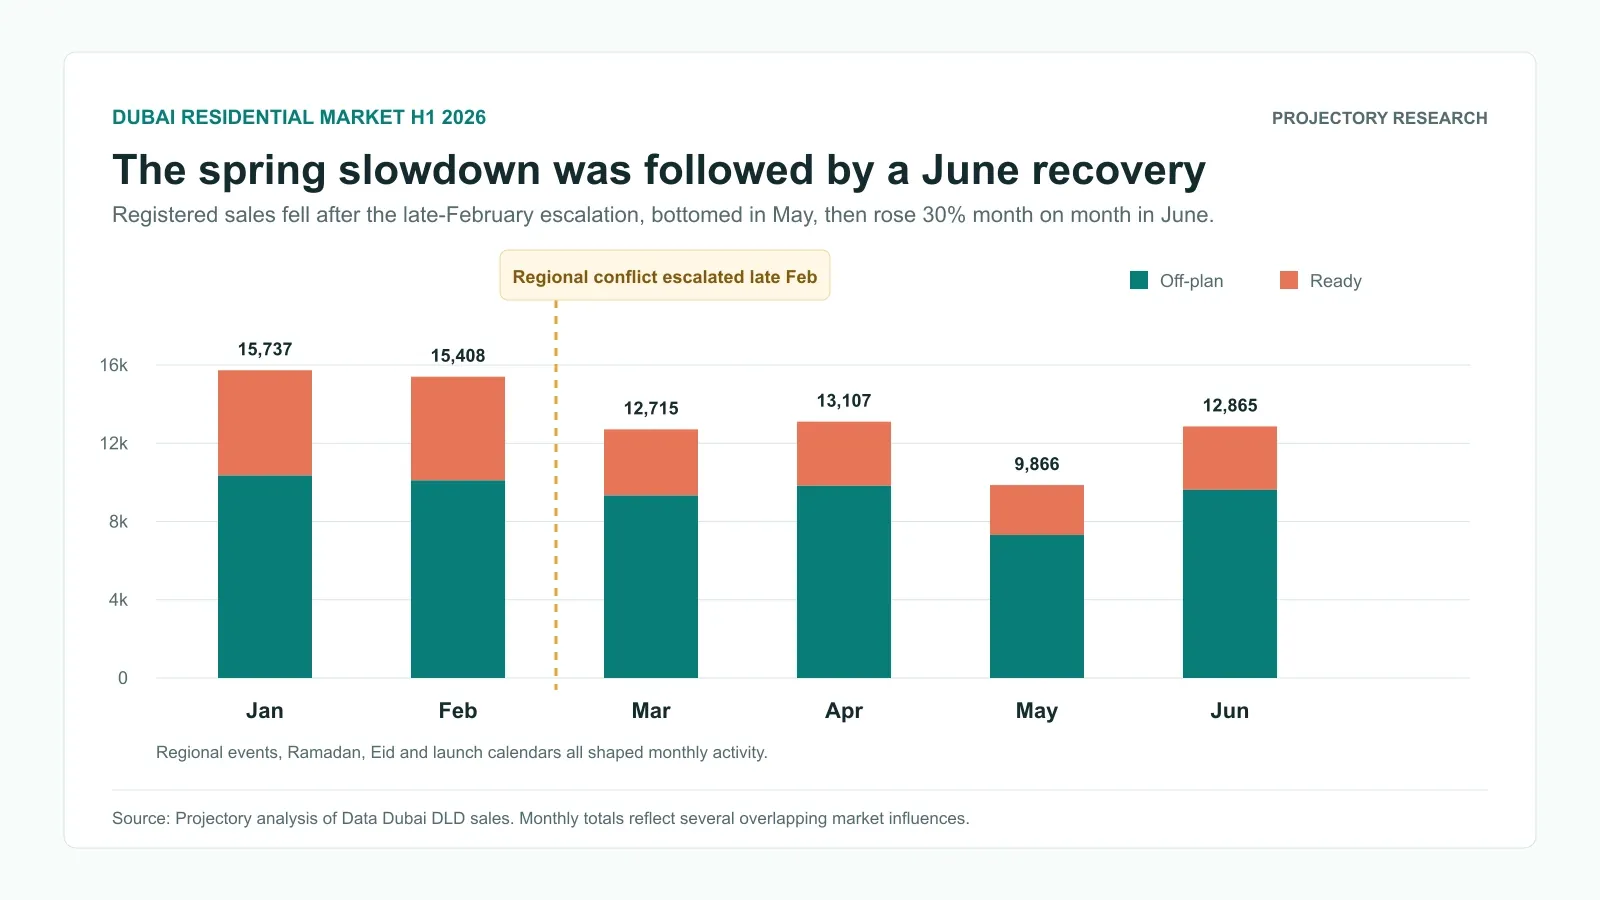
The regional conflict coincided with the sharpest part of the slowdown. Ramadan, Eid, disrupted travel, developer launch calendars and the lag between reservation and registration also shaped the monthly figures.
Ready-property activity reacted more heavily. Off-plan maintained a sales share above 73% from March through June, supported by committed purchase schedules, payment flexibility and launches already in motion. June’s rebound showed buyers returning, although registrations remained below the pace recorded a year earlier.
Where buyers spent by price band
Dubai’s deepest pool of residential demand sat between AED 1m and AED 5m. This range generated 49,015 sales, equal to 61.5% of H1 activity. Off-plan accounted for 75.5% of them.
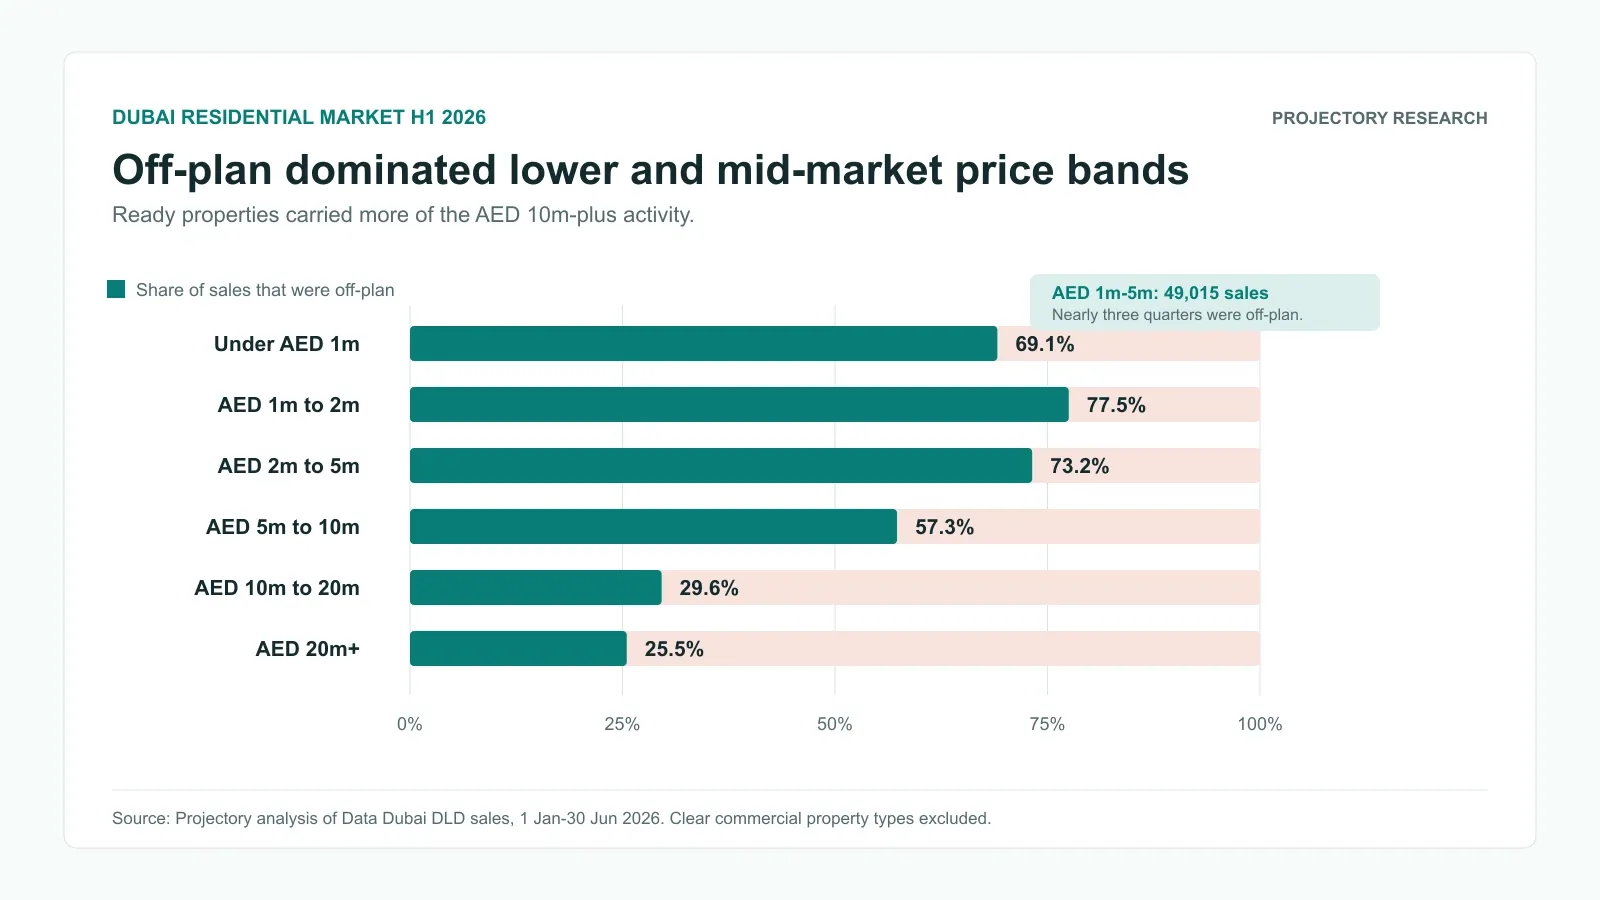
| Sale price | H1 sales | Off-plan share | Market reading |
|---|---|---|---|
| Under AED 1m | 23,728 | 69.1% | Developer stock led entry-level demand. |
| AED 1m to 2m | 26,102 | 77.5% | This band recorded the strongest off-plan share. |
| AED 2m to 5m | 22,913 | 73.2% | New developments dominated the mid-market. |
| AED 5m to 10m | 4,156 | 57.3% | Off-plan retained a clear majority. |
| AED 10m to 20m | 1,827 | 29.6% | Ready properties produced seven in ten sales. |
| AED 20m+ | 972 | 25.5% | Completed assets led sales and value. |
The AED 10m-plus market generated 2,799 sales worth AED 77.3bn. Ready properties represented 71.8% of sales and 75.4% of value in this range.
Citywide averages have limited use when assessing an individual purchase. An AED 1.5m off-plan apartment and an AED 15m completed villa serve different buyers and react to different supply. Useful comparables match the price band, area, property type and condition as closely as possible.
226 projects recorded their first off-plan sales
DLD records show 226 project numbers registering their first off-plan sale between 1 January and 30 June 2026.
Developers announce communities, phases and buildings in different ways. The first registered off-plan sale gives each project a consistent point in DLD’s transaction history. Marketing can begin earlier.
Those 226 projects generated 20,309 off-plan sales worth AED 45.2bn during H1. They contributed 35.9% of H1 off-plan sales and 36.3% of off-plan value.
New selling activity continued throughout the half-year:
- January: 52 projects
- February: 41 projects
- March: 47 projects
- April: 37 projects
- May: 20 projects
- June: 29 projects
| Leading area for newly selling projects | Projects | H1 off-plan sales | H1 value |
|---|---|---|---|
| Al Yelayiss 1 | 8 | 2,362 | AED 8.0bn |
| Madinat Al Mataar | 19 | 1,905 | AED 3.3bn |
| Palm Deira | 26 | 1,665 | AED 6.2bn |
| Jabal Ali First | 17 | 1,444 | AED 2.4bn |
| Wadi Al Safa 3 | 14 | 1,315 | AED 2.2bn |
More than a third of H1 off-plan registrations came from projects that had only just entered DLD’s sales history. Fresh inventory continued to attract buyers throughout the slowdown.
The choice gives buyers room to compare developer delivery, escrow registration, construction progress, payment exposure and competing supply before committing.
DLD records 94 project completions in H1
According to DLD records, 94 projects with a completion date in H1 2026 were marked Finished and 100% complete.
Together, the completed projects contain:
- 39,327 units
- 5,310 villas
- 6 land records
- 44,643 properties in total
April brought the largest wave of completions, with 29 projects. DLD recorded 12 in January, 14 in February, 12 in March, 10 in May and 17 in June.
For buyers researching a particular development, DLD’s Project Status Enquiry provides the relevant project-level check.
The areas that led H1 sales
DLD area names follow official administrative boundaries. Some differ from the community names used in property advertising. Projectory’s UAE off-plan areas guide helps translate the broader community choices into buyer goals, budgets and supply checks.
Off-plan leaders
| Area | Sales | Value |
|---|---|---|
| Madinat Al Mataar | 7,516 | AED 10.0bn |
| Wadi Al Safa 5 | 3,956 | AED 4.7bn |
| Al Yelayiss 1 | 3,173 | AED 10.6bn |
| Al Barsha South Fourth | 3,122 | AED 3.5bn |
| Palm Deira | 3,023 | AED 10.6bn |
Madinat Al Mataar led off-plan volume by a wide margin. Al Yelayiss 1 and Palm Deira each generated approximately AED 10.6bn, showing the influence of higher ticket sizes alongside sales count.
Ready-property leaders
| Area | Sales | Value |
|---|---|---|
| Al Barsha South Fourth | 1,985 | AED 2.4bn |
| Marsa Dubai | 1,217 | AED 4.0bn |
| Jabal Ali First | 1,185 | AED 1.8bn |
| Business Bay | 1,176 | AED 2.6bn |
| Al Merkadh | 989 | AED 2.7bn |
Al Barsha South Fourth led ready-property volume and ranked fourth for off-plan sales. Marsa Dubai and Business Bay retained deep completed-property activity, while Jabal Ali First appeared among the leaders on both sides of the market.
What H1 means for buyers, owners and developers
Off-plan buyers: New projects retained liquidity during a difficult half-year. Compare each development with nearby launches in the same price band, then check escrow registration, construction progress, payment dates, future supply and the developer’s delivery record.
Ready-home buyers: Lower secondary-market activity creates more room for careful negotiation. Use recent DLD sales from the same building or community and match property type, size, condition and view.
Owners and sellers: Ready-home sales fell more sharply than off-plan activity. Accurate pricing carries greater weight in a selective market, especially where several similar units compete for the same buyer.
Developers and brokers: Buyers continued to engage with fresh inventory, particularly from AED 1m to AED 5m. The number of newly selling projects also created intense competition for attention and booking capital.
Frequently asked questions
How many Dubai residential property sales did DLD record in H1 2026?
Projectory’s 10 July DLD snapshot contains 79,698 residential-market sales dated from 1 January to 30 June 2026. These sales were worth AED 227.1bn.
Was off-plan or ready property stronger in H1 2026?
Off-plan led by volume and recorded year-on-year growth. Sales increased 3.9% to 56,565. Ready-property sales fell 40.0% to 23,133. Off-plan represented 71.0% of H1 sales.
How many home sales took place in Dubai during H1 2026?
DLD recorded 75,746 sales of apartments, villas, townhouses and hotel apartments in Projectory’s residential-market classification. Home sales fell 6.3% against H1 2025 and were worth AED 167.2bn.
Which developers led Dubai off-plan activity in H1 2026?
Projectory’s analysis places Azizi Developments first by registration count with 6,101 off-plan transactions. DAMAC Properties leads by registered value at AED 14.6bn. DLD records sales against each project, including some homes resold by buyers before handover.
How many Dubai projects began selling in H1 2026?
DLD records show 226 project numbers registering their first off-plan sale during H1. These projects generated 20,309 off-plan sales worth AED 45.2bn.
How many Dubai projects completed in H1 2026?
According to DLD records, 94 projects with a completion date in H1 2026 were marked Finished and 100% complete. Together, they contain 44,643 properties, including 39,327 units and 5,310 villas.
How did the regional conflict affect Dubai property sales?
DLD residential-market registrations fell 17.5% from February to March and reached their H1 low in May. June then rose 30.4% month on month. Ready-property sales experienced the larger decline. Ramadan, Eid, launch schedules, travel disruption and registration timing also influenced the monthly pattern.
How these figures are built
Projectory pulled the figures directly from Data Dubai’s DLD records on 10 July 2026. The report covers registered sales from 1 January to 30 June and excludes mortgages, gifts and clearly commercial property. Each DLD transaction ID is counted once, and DLD’s own registration type separates off-plan from ready property.
The completed-project count includes only projects with an H1 completion date that DLD marks as Finished and 100% complete. A listed end date alone does not qualify because a project under construction can carry its planned completion date in the register. Property totals come from DLD’s project records.
DLD can add or correct past transactions after month-end, so historical totals may move slightly. Registrations can also appear after a buyer reserves or signs for a property. A newly selling project enters the report from its first recorded DLD off-plan sale, while total value can move sharply when more land or whole buildings change hands.
Cite this research
For research, press or analyst citations, use: Projectory Research, “Dubai Property Market H1 2026: DLD Data Report”, July 2026. The analysis covers Dubai Land Department sales registered from 1 January through 30 June 2026, using a dataset pulled on 10 July.
Sources
About the Projectory Team
Projectory’s editorial content is created and reviewed by its founders, who bring more than 30 years of combined experience brokering, buying, developing and selling property in the UAE.