31 August–5 September 2026: Dubai and Abu Dhabi Property Transactions Report
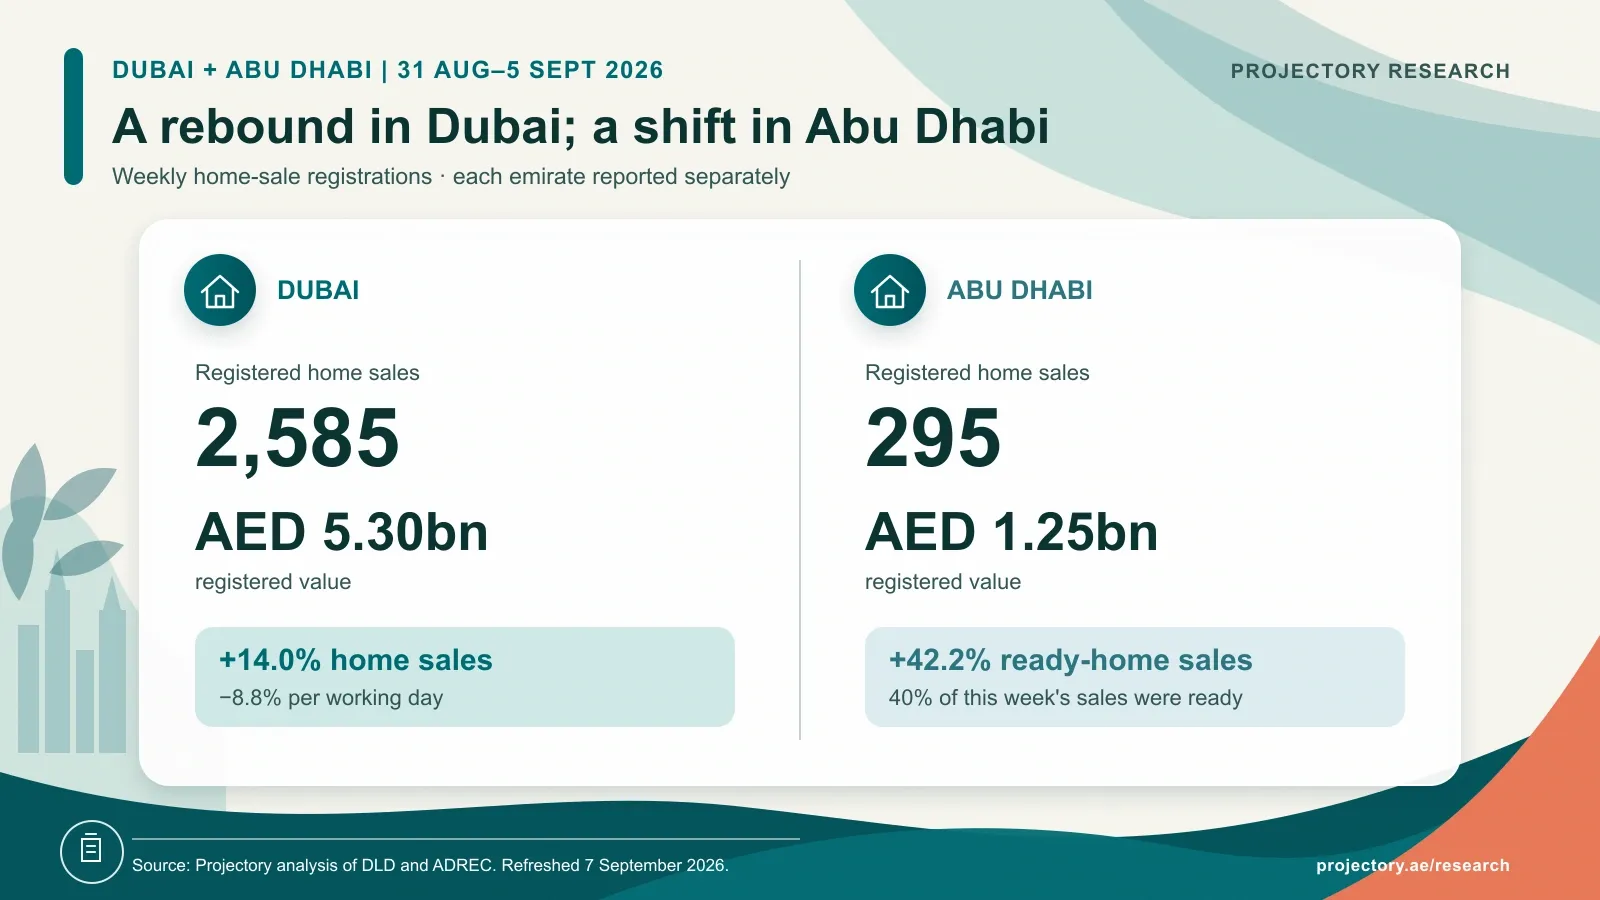
Dubai recorded 2,585 home sales worth AED 5.30bn. Abu Dhabi registered 295 worth AED 1.25bn, with ready-home sales rising 42.2% as off-plan activity eased.
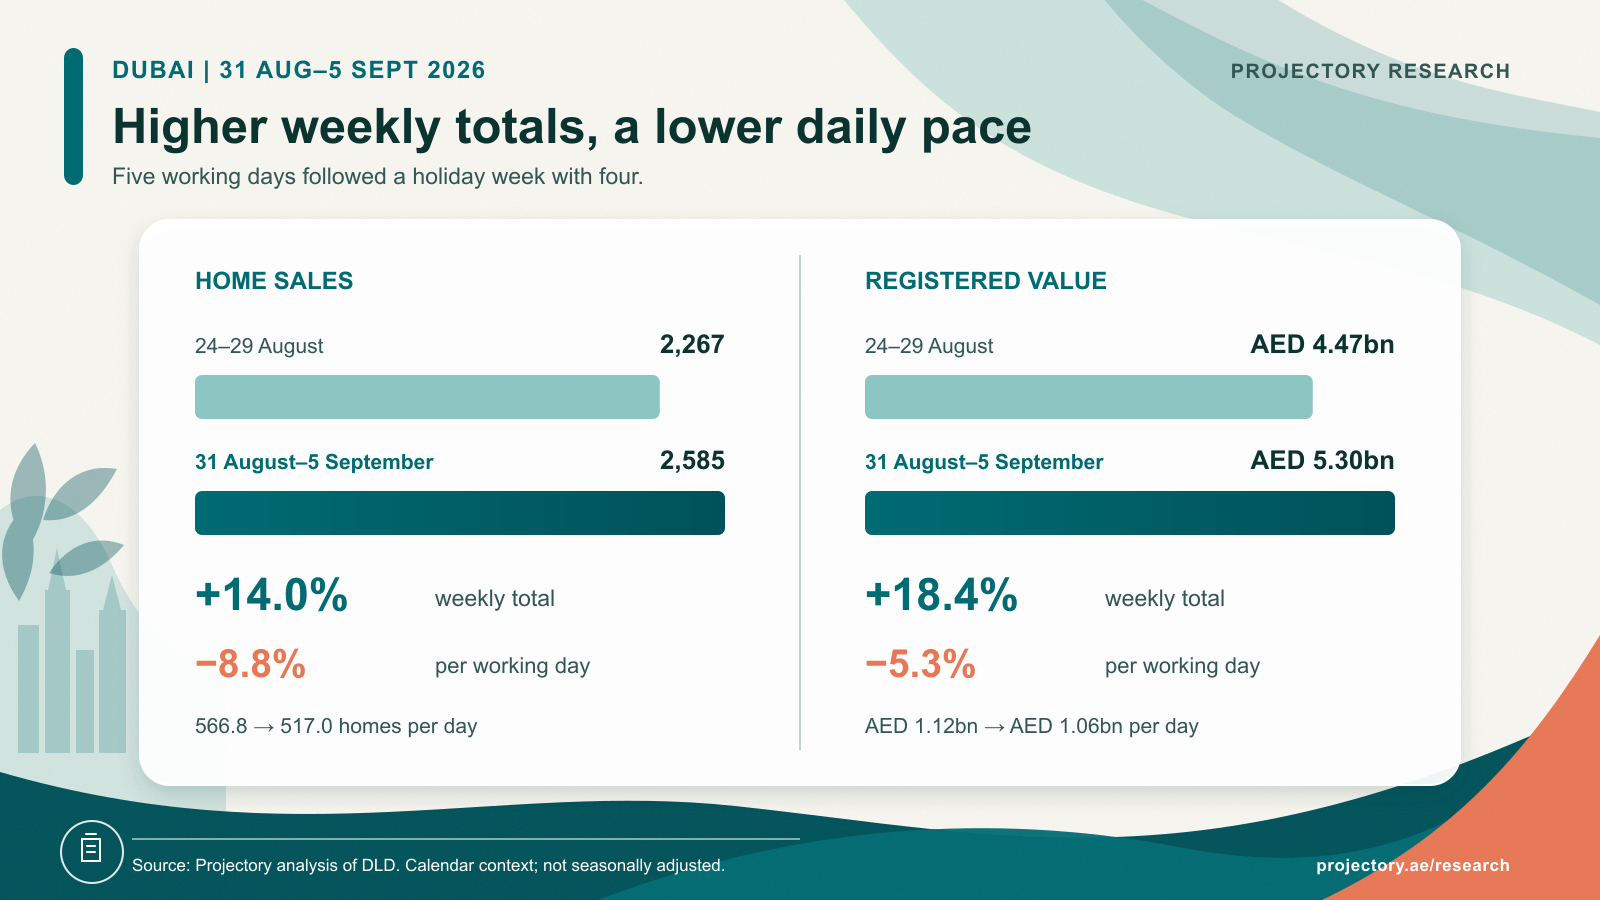
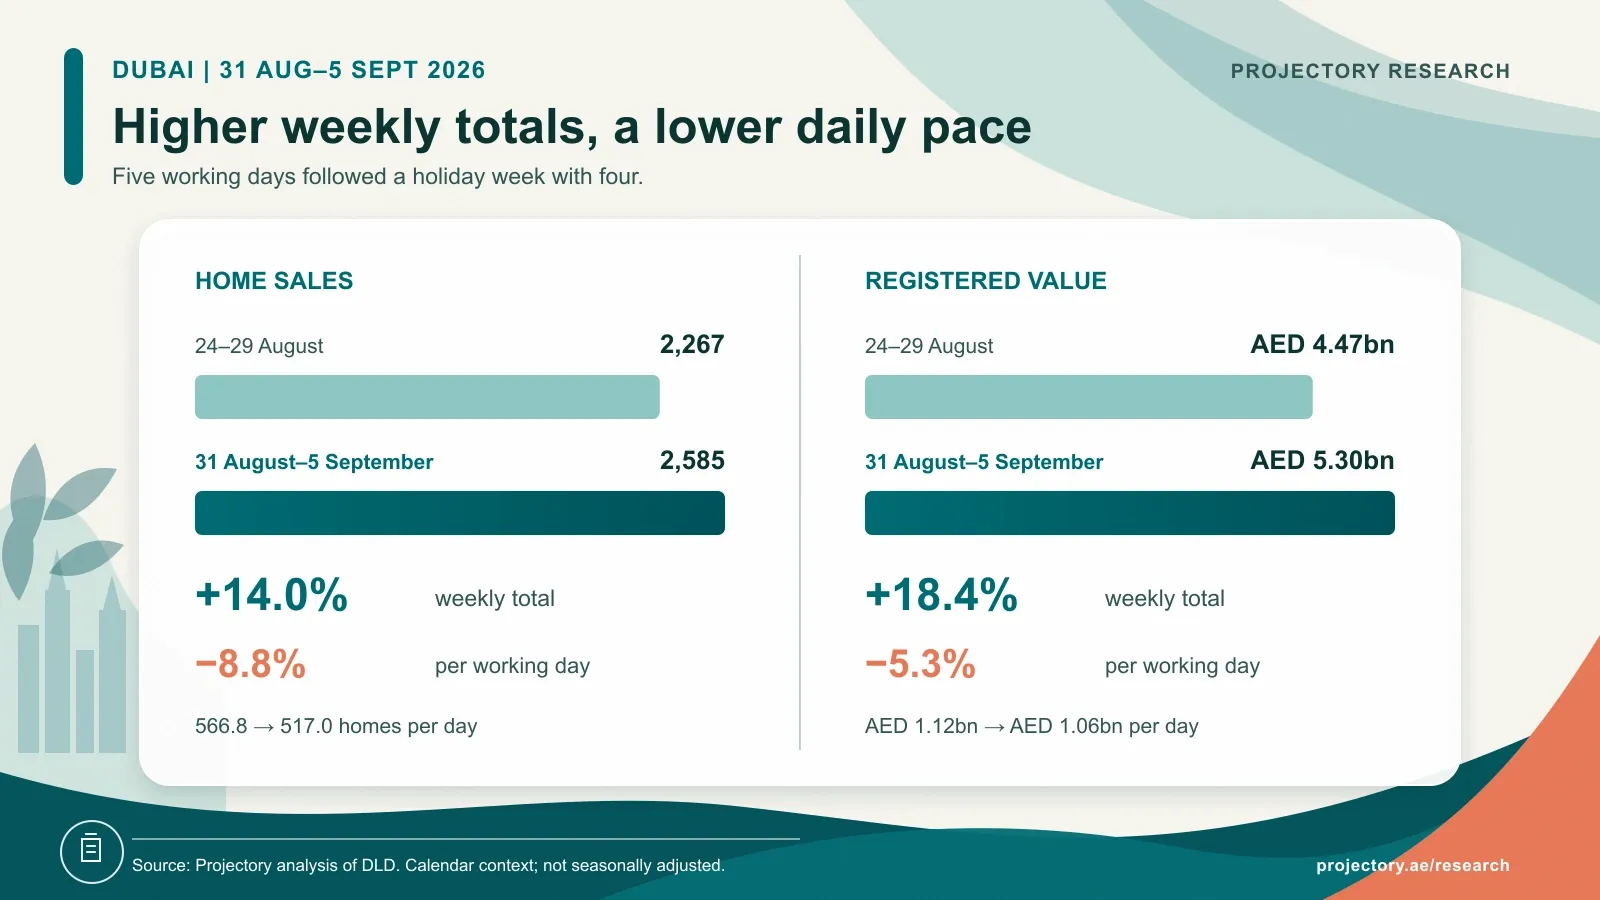
Dubai’s registered home sales rose 14.0% to 2,585 in the week of 31 August–5 September 2026, but the return to five working days explains much of the rebound: sales per working day were 8.8% lower than in the holiday-shortened comparison week.
Registered value reached AED 5.30bn in Dubai and AED 1.25bn in Abu Dhabi. Abu Dhabi’s 295 home sales followed an unusually large week of off-plan registrations. Within that slower total, ready-home sales increased, giving buyers a different picture from the headline decline.
The week at a glance
- Dubai’s recovery was led by off-plan volume. Registrations rose 20.3% to 1,914; ready-home sales were almost unchanged at 671.
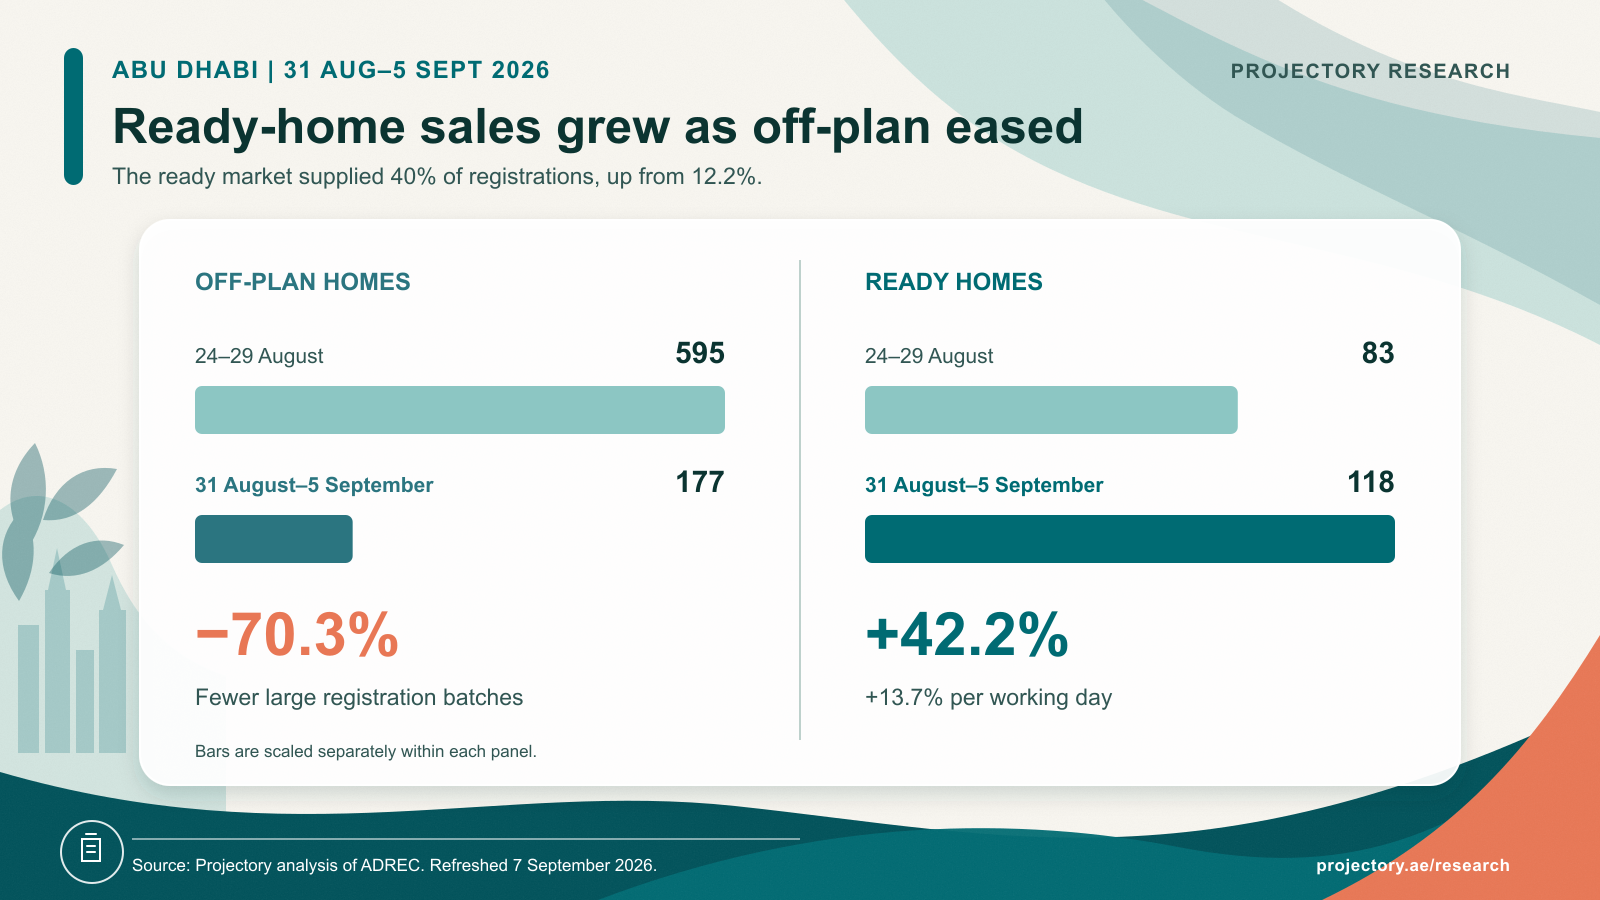
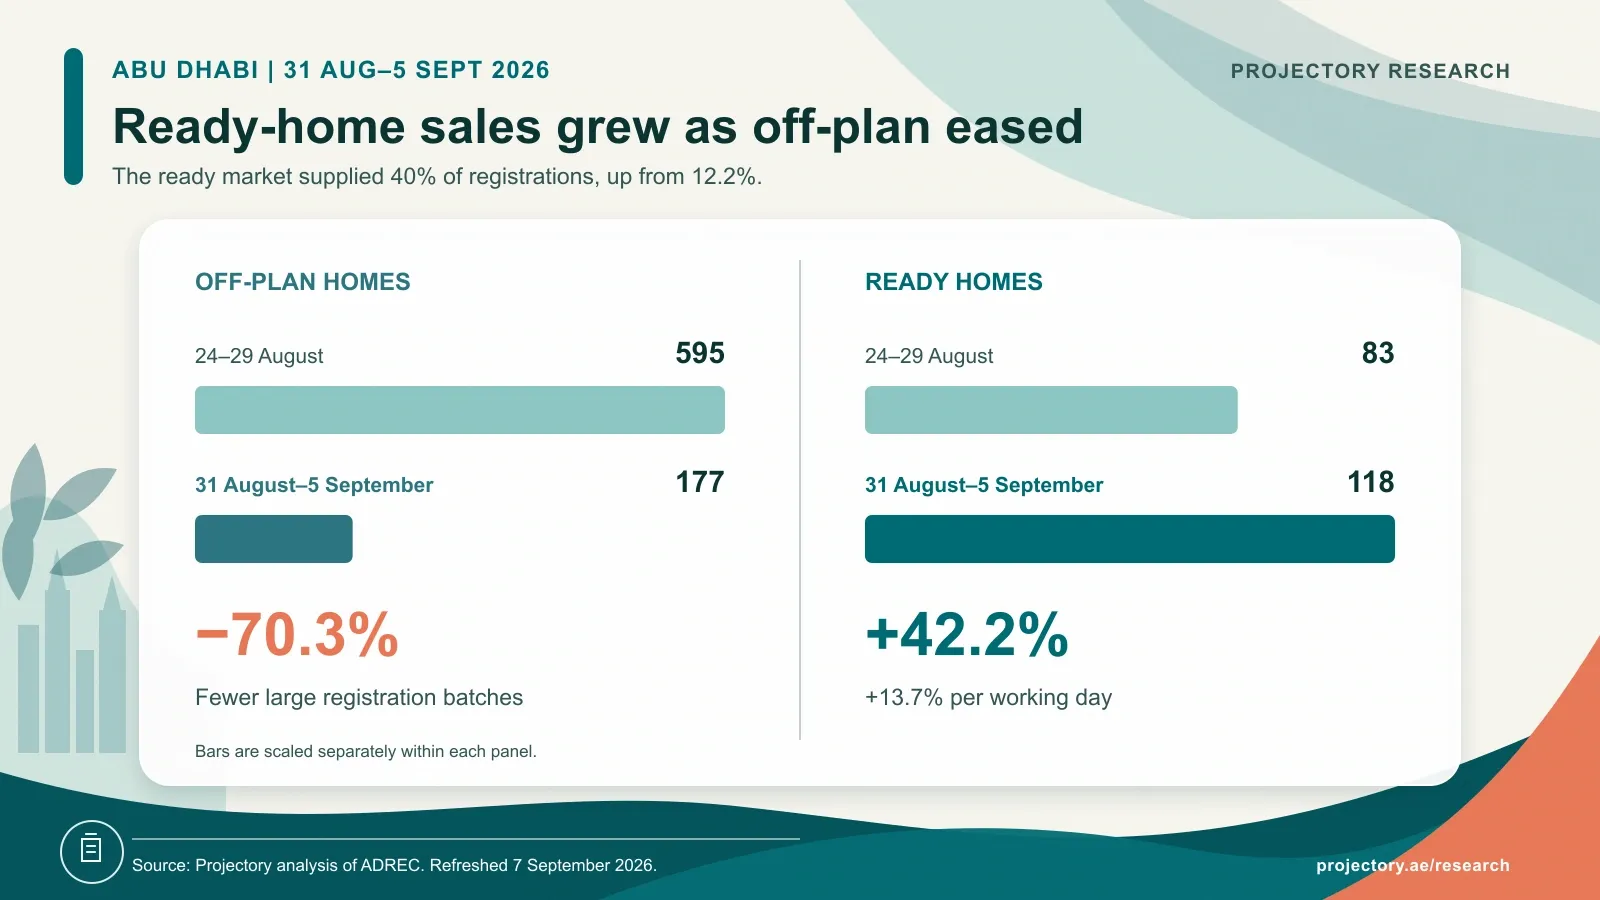
- Abu Dhabi’s ready market moved against the overall trend. Its 118 sales were up 42.2%, while off-plan registrations fell 70.3% to 177.
- A new annual milestone: Abu Dhabi’s 2026 home-sale value passed 125% of the entire 2025 total on 4 September.
31 August–5 September versus 24–29 August. Both periods use the 7 September refresh. Homes exclude separately registered plots and whole residential assets.
Dubai: more sales across a longer working week
The extra working day matters. Dubai averaged 517 home sales per working day, compared with 566.8 in the previous period. Registered value per working day fell 5.3%, from AED 1.12bn to AED 1.06bn. These figures put the higher weekly total into calendar context; they are not seasonally adjusted measures.
Free to reuse with attribution. Credit and link to the original Projectory Research analysis.
Reuse termsOff-plan homes accounted for 74.0% of registrations, up from 70.2%. Azizi Venice remained the busiest named development with 213 sales, followed by Binghatti Skyterraces with 84 and Binghatti Skyflame 1 with 80. Dubai South led locations by count with 287 home registrations.
At the upper end, 39 homes sold for AED 10m or more, together worth AED 1.01bn. The largest registration was a six-bedroom ready villa at Eome on Palm Jumeirah, at AED 260m on 1 September. That single home represented 4.9% of Dubai’s weekly value, illustrating the influence of large sales on a short reporting window.
Abu Dhabi: ready-home sales rise as large batches subside
The previous week’s scale was heavily influenced by Hudayriyat and Ramhan. Together, those two locations went from 384 home registrations worth AED 3.88bn to 22 worth AED 138.9m. Their reduction accounted for 97.3% of Abu Dhabi’s AED 3.84bn weekly value decline.
That concentration explains why the overall slowdown should be read alongside the sale-status split. Ready homes supplied 40.0% of registrations, compared with 12.2% a week earlier. Their sales per working day increased 13.7%, even after allowing for the longer working week.
Free to reuse with attribution. Credit and link to the original Projectory Research analysis.
Reuse termsADREC classified the 177 off-plan registrations as 139 initial sales and 38 resales. Qasr Al Jurf – Phase 3B was the busiest named development with 31 home sales. Al Reem Island led locations with 69, followed by Yas Island with 44. The largest home registration was an AED 81.9m villa at Bada Al Jubail – Phase 2.
The longer view continued to advance. By 5 September, Abu Dhabi’s 2026 home-sale value had reached AED 86.91bn, 25.1% above full-year 2025’s AED 69.47bn. The 125% threshold was first crossed during this report week, on 4 September. Home-sale count stood at 19,398, still below the previous full year’s 21,400.
Projectory’s take: Dubai’s higher weekly totals need to be read alongside the extra working day and the influence of large individual sales. In Abu Dhabi, the retreat in concentrated off-plan registrations coexisted with more ready-home transactions. Buyers gain a more useful comparison by looking at the same location, property type and sale status across several periods before drawing a conclusion about prices or demand.
How these figures are built
Projectory analysed canonical DLD and ADREC home-sale registrations for Monday 31 August through Saturday 5 September, compared with 24–29 August. Each transaction is counted once. Both periods were refreshed on 7 September 2026; Dubai’s register extends through 7 September and Abu Dhabi’s through 6 September, covering the report window.
The refreshed comparison totals are 2,267 Dubai homes and 678 Abu Dhabi homes, versus 2,320 and 680 in the previous report’s earlier snapshot. Registries add, correct and withdraw records. All changes here use the refreshed figures for both periods; the earlier publication remains a dated release.
Friday 28 August was a public holiday, leaving four working days in the comparison period and five in this report. Registrations can still appear on weekends or holidays.
Homes include apartments, duplexes, penthouses, townhouses and villas, following the audited source classifications. Residential plots and whole residential buildings or complexes are reported separately in the CSV. Commercial and mixed-use property, mortgages, gifts and other non-sale transactions are excluded. Dubai’s source cannot reliably distinguish initial off-plan sales from resales.
Prices are registered values. Medians in the dataset describe the transaction mix, not underlying price appreciation. Price-per-square-foot medians use positive display areas: 2,440 Dubai homes and 279 Abu Dhabi homes in the current week. The annual milestone uses daily cumulative home-sale value against the same refreshed full-year 2025 series.
Cite this research
Projectory Research, “31 August–5 September 2026: Dubai and Abu Dhabi Property Transactions Report”, 7 September 2026, dataset version 1.0. Link to this research.
Download the data
Download the aggregated CSV for the weekly comparisons, sale-status split, price bands, leading projects and areas, medians, concentration and annual context. The graphics’ three-dot menus provide reusable PNGs, credits, embed codes and underlying data. Projectory’s original analysis and graphics are available under CC BY 4.0.
Continue exploring Projectory Research
- Previous weekly report: 24–29 August 2026
- Dubai’s August 2026 home-sales report
- Abu Dhabi’s August 2026 home-sales report
- Explore Dubai transactions and Abu Dhabi transactions
Sources
Projectory Research data
Download the report aggregates
Separate Dubai and Abu Dhabi weekly home-sale totals, working-day comparisons, off-plan and ready activity, property types, price bands, leading projects and areas, medians, concentration and annual context.
- Period
- 2026-08-31/2026-09-05
- Versions
- Dataset 1.0 · Method 1.0
- Status
- Initial release
- Coverage
- Dubai and Abu Dhabi, United Arab Emirates
- Data refreshed
- 7 September 2026
The file contains grouped market statistics and no personal details or individual transaction records. Suggested citation: Projectory Research, 31 August–5 September 2026: Dubai and Abu Dhabi Property Transactions Report, 7 September 2026, dataset version 1.0.
The reuse licence applies to Projectory's original analysis, tables and graphics. Underlying government records remain subject to the source provider's terms.
Revision history
- Version 1.0 · — Initial report and aggregate dataset; both weekly periods and annual comparisons refreshed to 7 September 2026.
Co-founder and Head of Research
About Alex Lovell
Alex has 12 years of real estate experience in the UAE, helping international investors and family offices make informed property purchases through a data-driven approach.
View Alex Lovell on LinkedIn