Abu Dhabi Property Market H1 2026: ADREC Data Report
Abu Dhabi recorded AED 117bn in H1 2026 property transactions. See sales, mortgages, off-plan demand, leading districts and luxury activity.
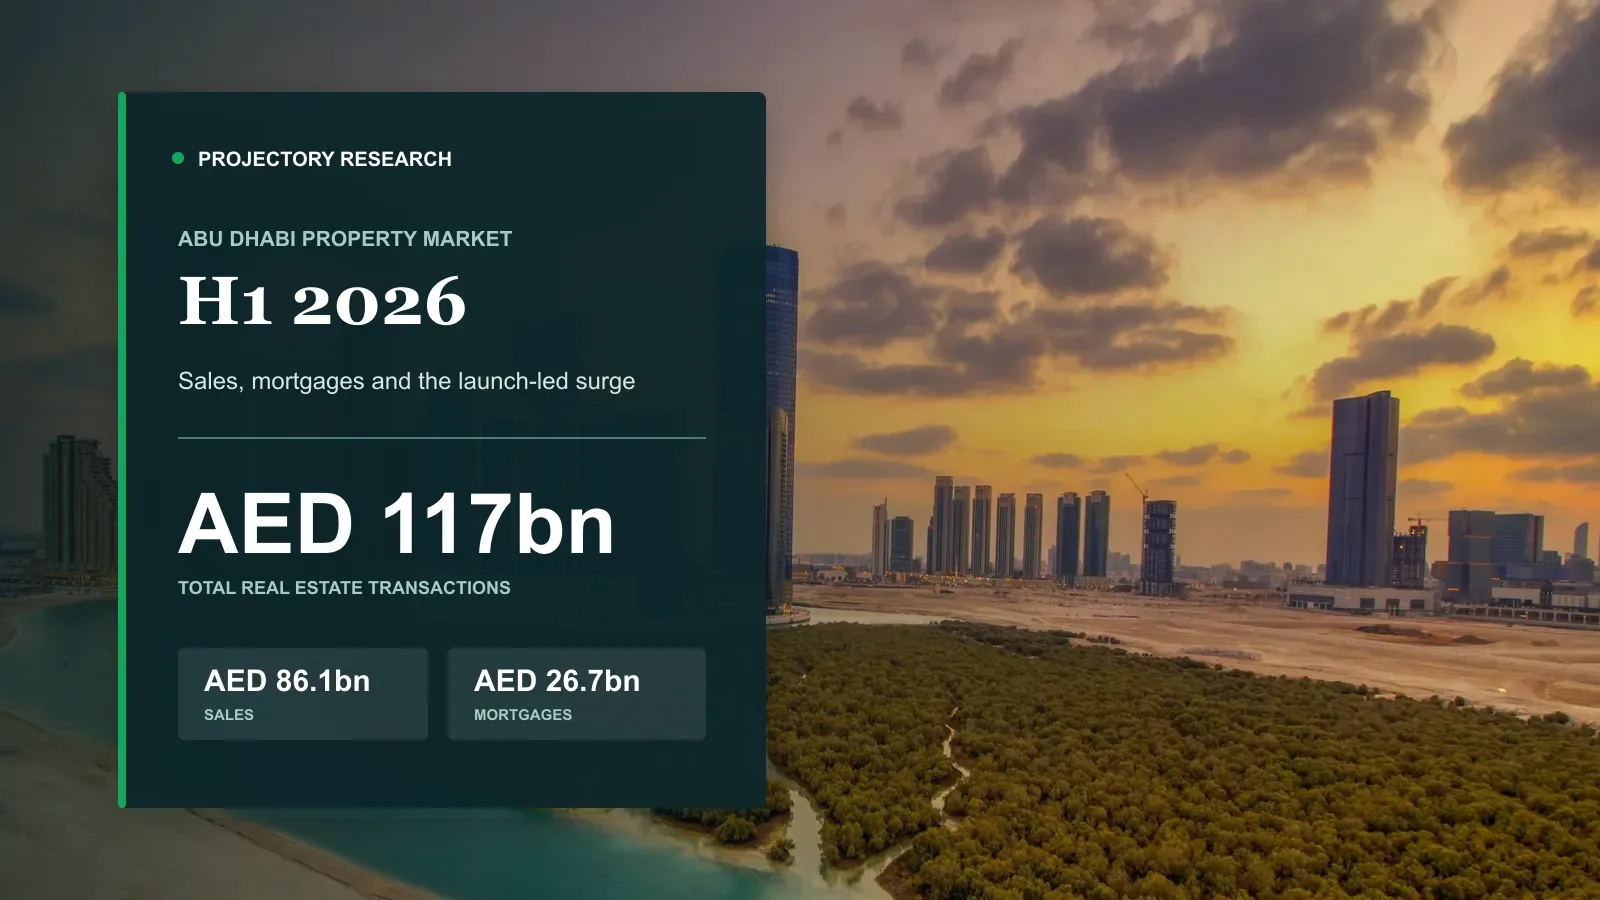
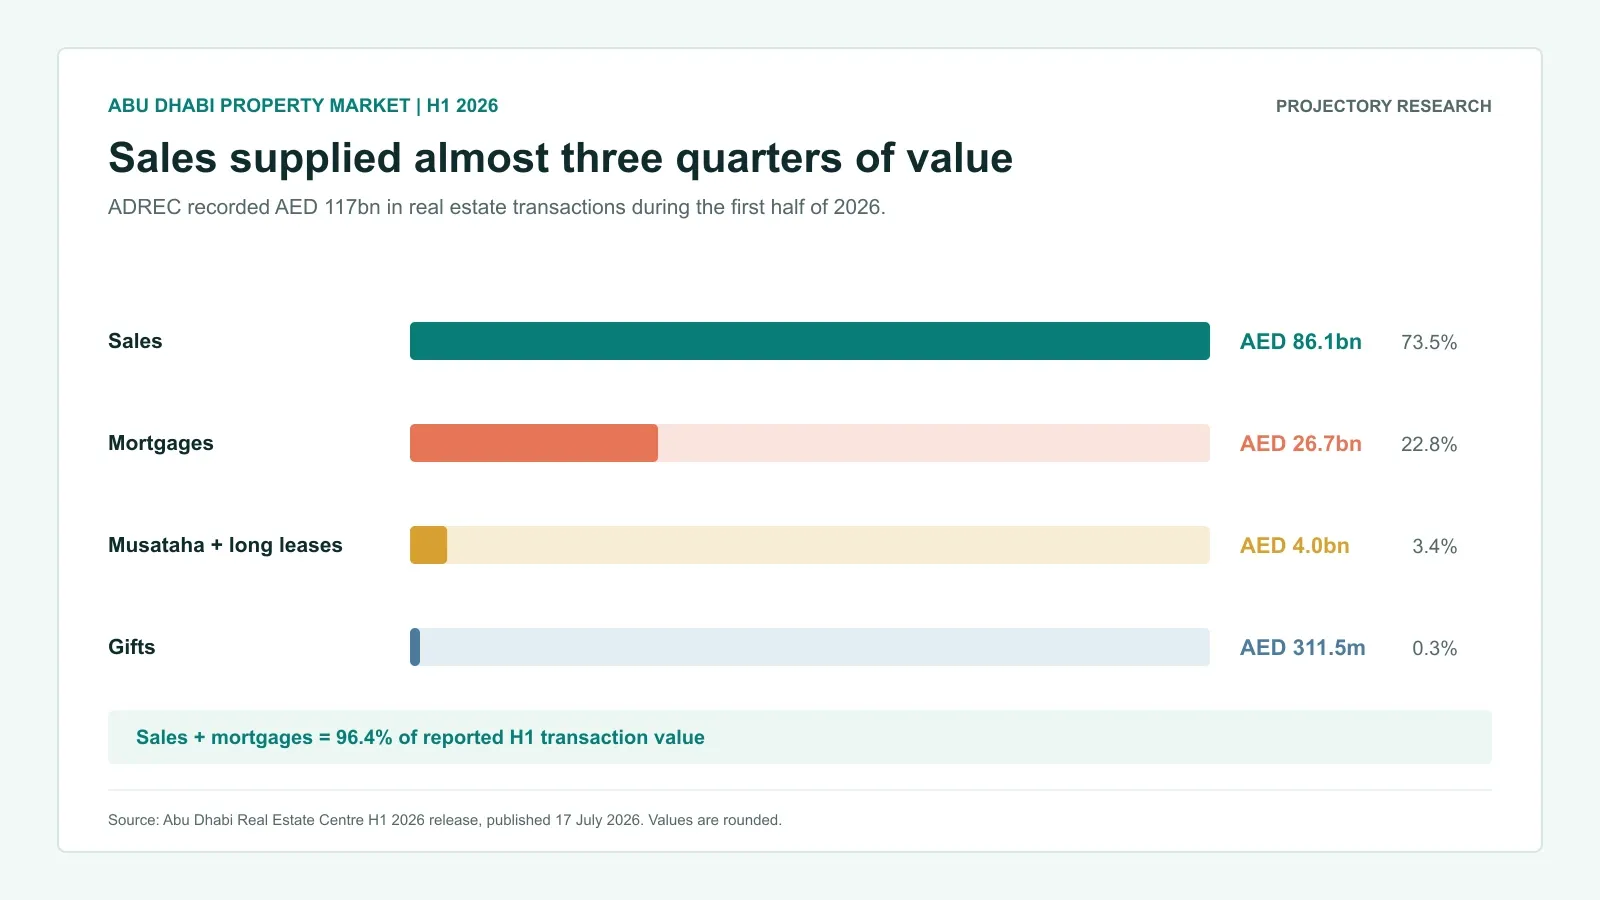
Abu Dhabi recorded AED 117bn in real estate transactions during the first half of 2026, an increase of 112% from H1 2025. Sales contributed AED 86.1bn, mortgages added AED 26.7bn and the balance came from long leases, musataha agreements and gifts.
The headline shows a market expanding quickly. The transaction rows explain how it happened. Off-plan sales moved to the centre of the market, premium island launches pulled more capital into villas, and the busiest location by sales count was different from the leader by value.
We analysed every sale dated from 1 January to 30 June in the public Abu Dhabi Real Estate Centre register. The detailed sales figures below use the register as refreshed on 10 August 2026. The overall H1 figures come from ADREC’s official release.
What’s in this guide:
- AED 117bn: where the market value came from
- Off-plan sales changed the shape of the market
- Villas matched apartments on value
- Reem led volume; Hudayriyat led value
- AED 10m-plus homes generated 41% of value
- Which projects led off-plan sales
- Q2 cooled after an exceptional first quarter
- What H1 tells buyers and investors
- How these figures are built
H1 2026 at a glance:
- AED 117bn in total real estate transactions
- AED 86.1bn in sales and AED 26.7bn in mortgages
- 78.2% of refreshed sales rows were off-plan
- Al Reem Island recorded the most sales; Hudayriyat led by value
- Apartments made up 74.3% of home sales, while villas slightly exceeded them on value
- Homes above AED 10m generated 41.4% of residential value
AED 117bn: where the market value came from
Sales generated almost three quarters of Abu Dhabi’s H1 transaction value. Mortgage registrations supplied a further AED 26.7bn across 8,876 transactions, while musataha and long-lease agreements reached AED 4bn. Gifts accounted for AED 311.5m.
The total number of real estate transactions increased 61.7% year on year. That measure covers the full market, including mortgages and other transaction types alongside sales.
| Transaction type | H1 2026 value | Share of reported total |
|---|---|---|
| Sales | AED 86.1bn | 73.6% |
| Mortgages | AED 26.7bn | 22.8% |
| Musataha and long leases | AED 4.0bn | 3.4% |
| Gifts | AED 311.5m | 0.3% |
International investment grew alongside the domestic market. Foreign direct investment reached AED 13.8bn, up 309% from H1 2025 and already above the full-year 2025 figure. ADREC recorded investors from 116 nationalities, compared with 82 a year earlier.
Investment zones generated AED 75bn, nearly three times the AED 26.7bn recorded in H1 2025. Eight new zones brought the emirate-wide total to 50, and 28 new projects were registered during the period. Those figures help explain why off-plan activity moved so sharply.
Off-plan sales changed the shape of the market
ADREC has since updated the H1 register to 16,953 sales worth AED 86.28bn. Off-plan property supplied 13,262 registrations worth AED 63.49bn. That equals 78.2% of sales volume and 73.6% of value.
For the same period in 2025, the register shows 8,688 sales worth AED 32.60bn. On that like-for-like basis, sales count almost doubled and value increased by 164.7%. Off-plan value rose from AED 17.70bn to AED 63.49bn.
| Sale status | H1 2025 | H1 2026 | Change in count |
|---|---|---|---|
| Off-plan | 4,915 | 13,262 | +169.8% |
| Ready | 3,716 | 3,621 | -2.6% |
| Court-mandated | 57 | 70 | +22.8% |
| All sales | 8,688 | 16,953 | +95.1% |
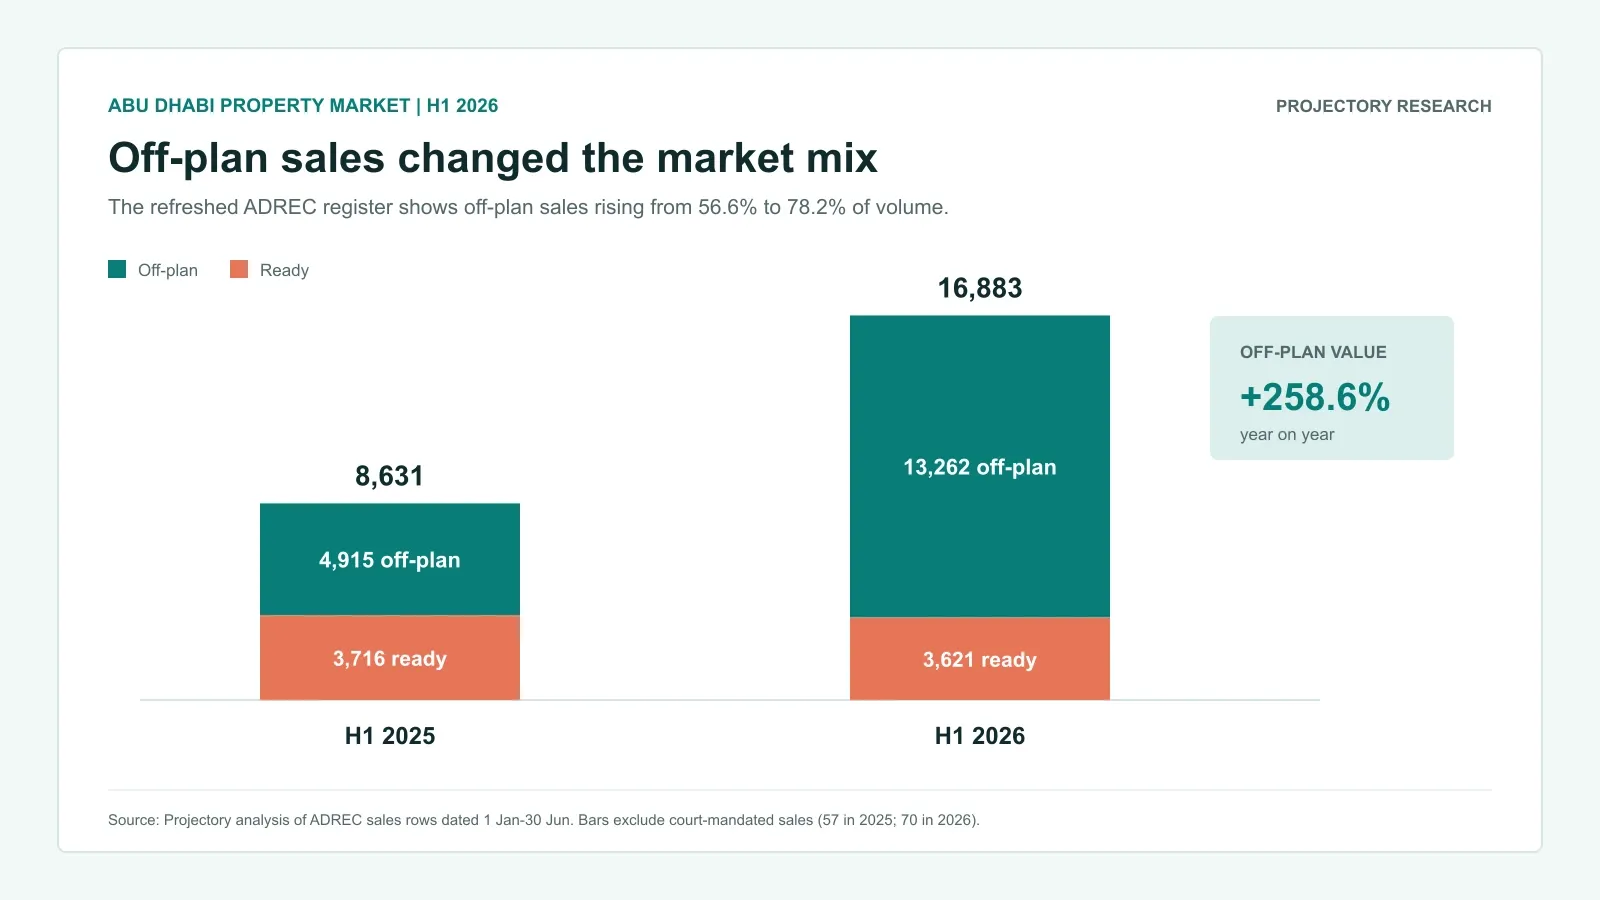
Ready-property volume stayed close to its 2025 level, yet its registered value rose by 52.9%. A small number of large ready transactions lifted that figure. Within the narrower home market, ready sales fell 8.6% by count and increased 3.3% by value.
Primary sales accounted for 70.7% of all registrations. The remaining 29.3% were secondary deals, including 1,871 off-plan resales before completion. Abu Dhabi therefore had a meaningful assignment market alongside the much larger flow of new developer sales.
Buyers who want the full ownership, registration and purchase process can use our off-plan property guide for Abu Dhabi.
Villas matched apartments on value
Looking specifically at apartments, villas, townhouses, duplexes and penthouses, ADREC recorded 15,368 home sales worth AED 68.43bn.
Apartments dominated transaction count, with 11,414 sales. Villas recorded only 3,031. Their values were almost identical: apartments generated AED 31.93bn and villas AED 32.43bn.
| Home type | Registered sales | Registered value | Share of home value |
|---|---|---|---|
| Apartments | 11,414 | AED 31.93bn | 46.7% |
| Villas | 3,031 | AED 32.43bn | 47.4% |
| Townhouses | 664 | AED 1.87bn | 2.7% |
| Duplexes and penthouses | 259 | AED 2.20bn | 3.2% |
The median villa sold for AED 7.67m, compared with AED 2.02m for an apartment. Large villa releases on Hudayriyat, Saadiyat, Ramhan and Fahid lifted the capital committed to the segment.
Off-plan supplied 12,616 of the 15,368 home sales. It also generated AED 61.03bn, or 89.2% of home value. The market added a large volume of future stock while buyers continued to pay a premium for location, larger floor plans and newly released waterfront communities.
Reem led volume; Hudayriyat led value
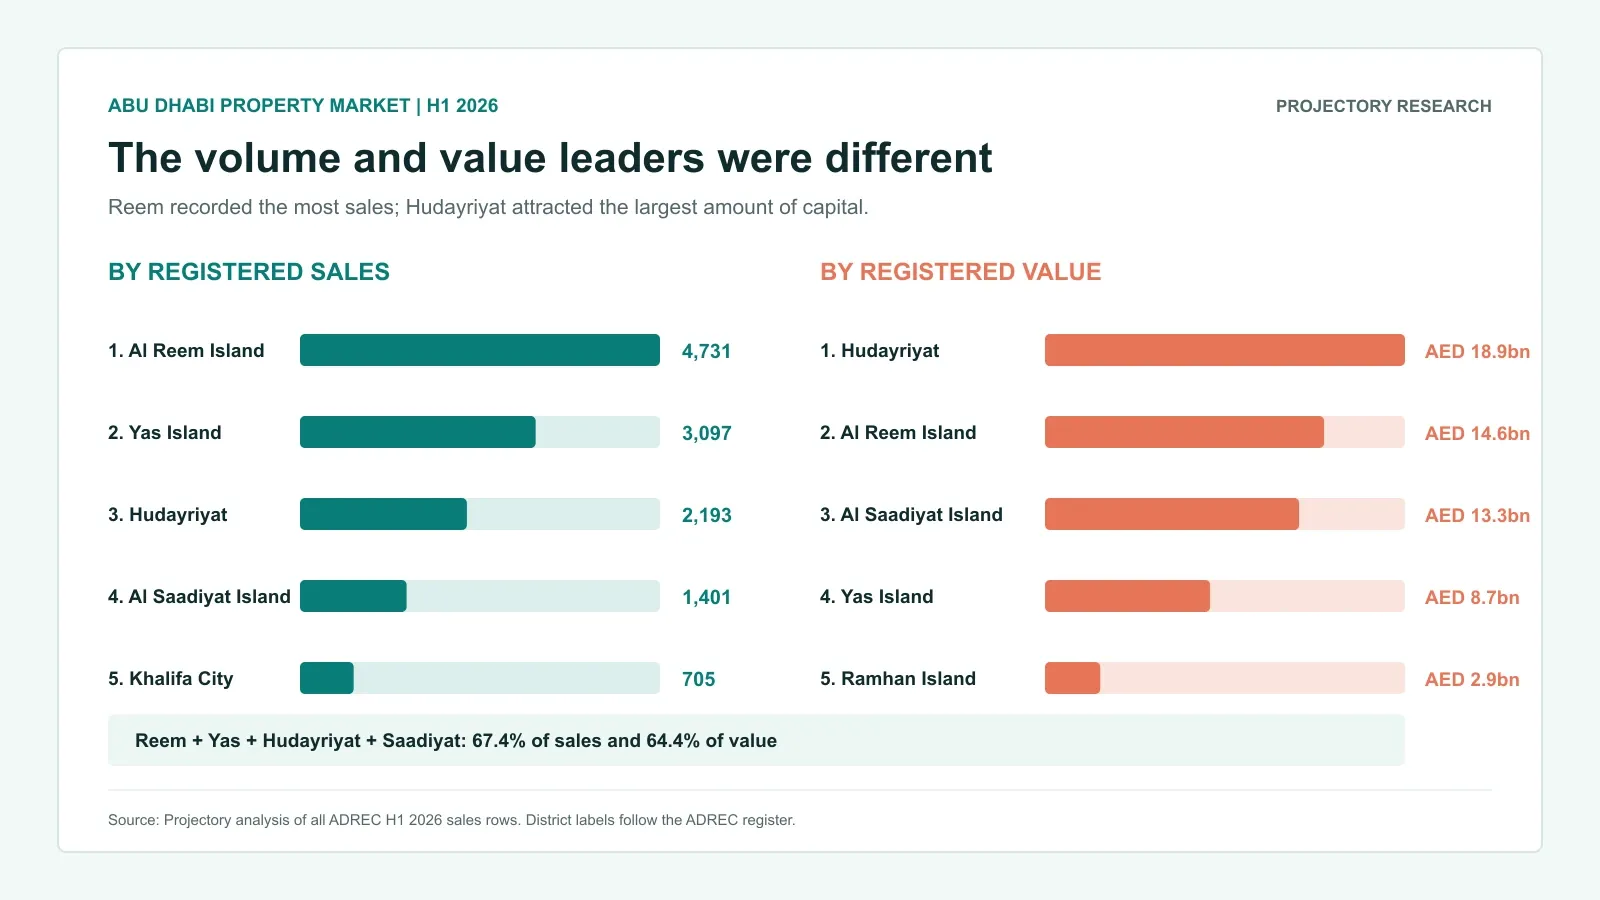
Al Reem Island recorded 4,731 sales worth AED 14.64bn, making it the busiest district in the emirate. Yas Island followed with 3,097 sales worth AED 8.67bn.
Hudayriyat moved to the top on value. ADREC records it as Al Hidayriyyat, and its 2,193 sales generated AED 18.89bn. Saadiyat ranked second on average ticket size among the four major districts, with 1,401 transactions worth AED 13.33bn.
| District | Sales | Registered value | Median sale |
|---|---|---|---|
| Al Reem Island | 4,731 | AED 14.64bn | AED 1.76m |
| Yas Island | 3,097 | AED 8.67bn | AED 2.05m |
| Hudayriyat | 2,193 | AED 18.89bn | AED 6.09m |
| Saadiyat Island | 1,401 | AED 13.33bn | AED 5.55m |
| Khalifa City | 705 | AED 2.65bn | AED 1.39m |
| Zayed City | 620 | AED 2.02bn | AED 3.10m |
Reem, Yas, Hudayriyat and Saadiyat supplied 67.4% of sales and 64.4% of value. Their roles differed. Reem and Yas provided apartment depth and broader ticket sizes, while Hudayriyat and Saadiyat drew more of the premium capital.
That pattern fits the buyer choices available in each location. Our guides to Yas Island and Saadiyat Island compare the current projects, payment plans and daily lifestyle in more detail.
AED 10m-plus homes generated 41% of value
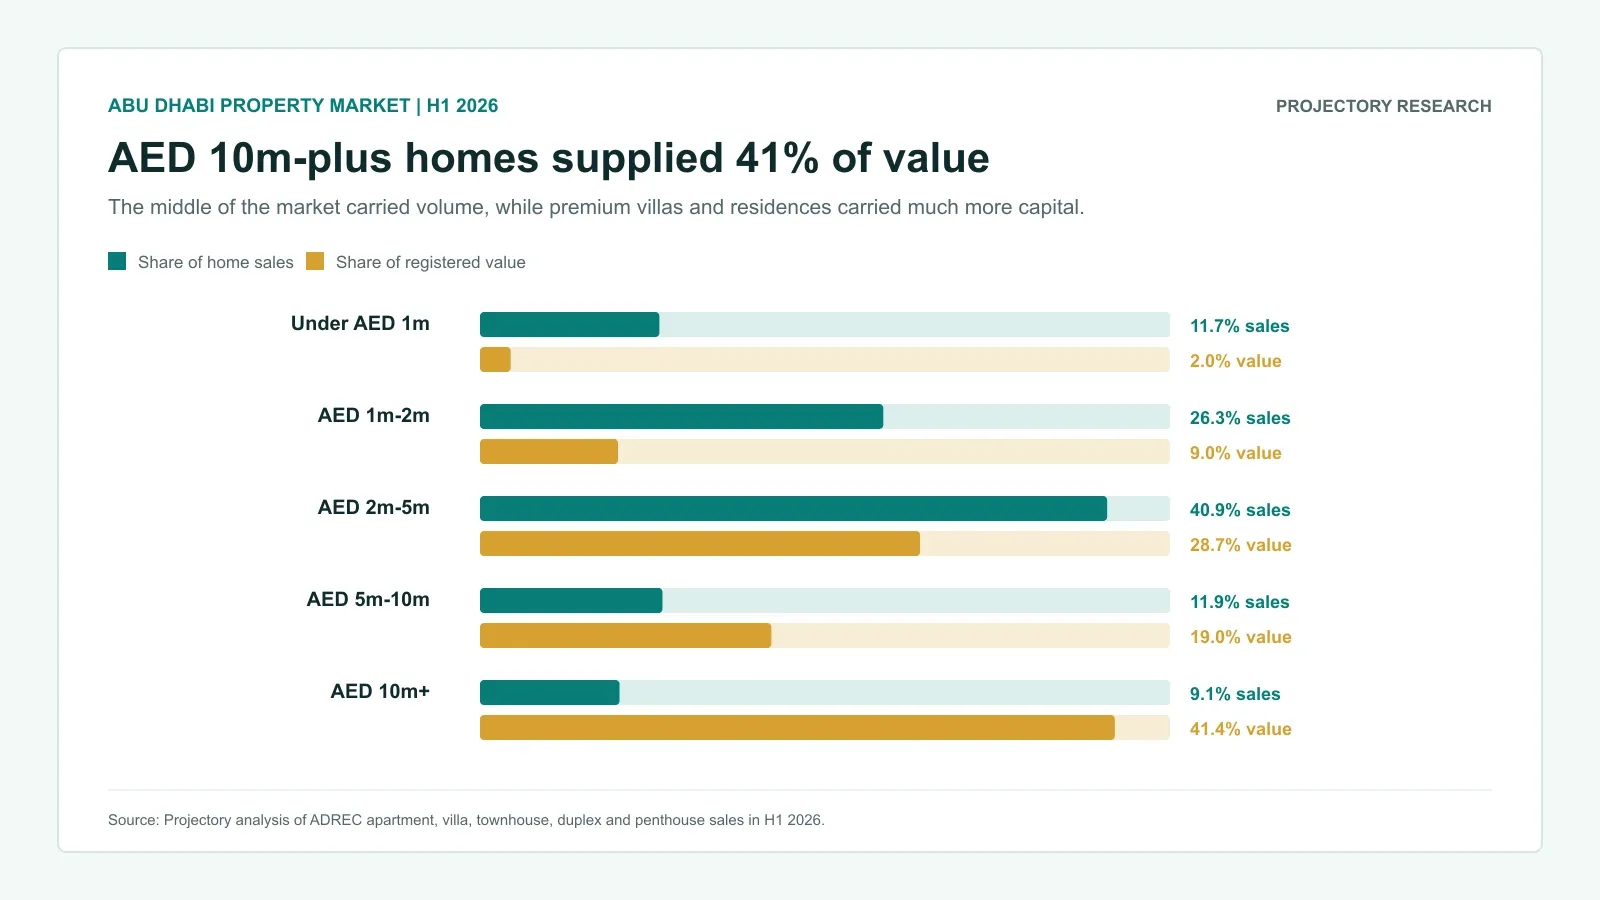
One of the clearest changes took place at the top of the residential market. ADREC recorded 1,406 home sales above AED 10m, up from 270 in H1 2025. They represented 9.1% of home sales and generated AED 28.29bn, equal to 41.4% of home value.
The middle of the market still carried the greatest volume. Homes from AED 2m to AED 5m supplied 40.9% of transactions, while homes below AED 2m supplied 37.9%.
| Home price | Home sales | Share of sales | Share of value |
|---|---|---|---|
| Under AED 1m | 1,792 | 11.7% | 2.0% |
| AED 1m to 2m | 4,041 | 26.3% | 9.0% |
| AED 2m to 5m | 6,282 | 40.9% | 28.7% |
| AED 5m to 10m | 1,823 | 11.9% | 19.0% |
| AED 10m+ | 1,406 | 9.1% | 41.4% |
The median home price rose from AED 2.02m to AED 2.49m, and the median registered price per square foot rose from AED 1,427 to AED 1,855. Those figures describe the mix of homes that sold. More new-build and luxury stock will lift a market median even when the value of an unchanged home moves by less.
The ready-home median reached AED 1,364 per square foot, 19% above H1 2025. That direction sits close to the annual gains reported for apartments on Yas, Reem and Saadiyat by major market consultancies.
Which projects led off-plan sales
Yas Riva Residences recorded the highest number of named off-plan sales, with 900 registrations worth AED 2.24bn. Al Naseem led by value at AED 4.34bn from 448 sales.
The difference between those leaders says plenty about the first-half market. Yas Riva brought a large apartment-led release at a median sale price of about AED 2.09m. Al Naseem’s villa sales carried a median of about AED 9.63m.
| Named off-plan project | Sales | Registered value | Median sale |
|---|---|---|---|
| Yas Riva Residences | 900 | AED 2.24bn | AED 2.09m |
| The Row Saadiyat | 516 | AED 3.14bn | AED 5.52m |
| Yas Park Place | 456 | AED 980m | AED 2.10m |
| Al Naseem | 448 | AED 4.34bn | AED 9.63m |
| Tara A | 443 | AED 982m | AED 2.40m |
The ten busiest named projects accounted for 33.7% of off-plan sales. The ten largest by value supplied 40.9% of off-plan value. ADREC recorded activity across 199 named projects, so the market had clear launch leaders without relying on a single development.
Q2 cooled after an exceptional first quarter
Sales reached AED 49.10bn across 8,886 registrations in Q1. Q2 recorded AED 37.18bn across 8,067 sales, a quarterly decline of 9.2% in count and 24.3% in value.
April was the busiest month by volume, with 3,528 sales. February produced the highest value at AED 22.90bn, helped by several large transactions. May had the lowest count and value before activity improved in June.
| Month | Sales | Registered value | Off-plan share |
|---|---|---|---|
| January | 2,901 | AED 13.52bn | 75.0% |
| February | 3,258 | AED 22.90bn | 78.9% |
| March | 2,727 | AED 12.69bn | 78.5% |
| April | 3,528 | AED 15.09bn | 80.8% |
| May | 2,197 | AED 9.52bn | 79.5% |
| June | 2,342 | AED 12.57bn | 75.9% |
The slowdown overlapped with regional disruption, softer sentiment and a less intense launch calendar. Registration data cannot separate those influences cleanly. Buyer demand remained strong enough for H1 to finish far ahead of the previous year, and June closed above May on both volume and value.
What H1 tells buyers and investors
Abu Dhabi’s growth came with a higher average ticket and a much larger off-plan pipeline. A buyer comparing this market with Dubai should expect fewer dominant locations, a stronger concentration around master-planned islands and a lower statutory registration charge. Our Dubai and Abu Dhabi comparison covers the practical differences in costs, lifestyle and buying process.
The data also gives buyers a useful way to frame value:
- Apartment buyers have the deepest transaction evidence on Reem and Yas. That helps when comparing floor plans, views and developer prices with recent registrations.
- Premium villa demand is setting the value story. Hudayriyat, Saadiyat and Ramhan carried much larger median tickets, so payment timing and resale depth deserve careful attention.
- Off-plan resale already has a measurable market. The 1,871 secondary off-plan registrations show that assignments happen at scale, although every project sets its own transfer conditions.
- Launch success varies by price band. Volume leaders around AED 2m and value leaders above AED 9m appealed to different buyers. Citywide averages blur that distinction.
FDI, new investment zones and the breadth of project activity all point to a market attracting more international attention. The second half will show whether Q2’s slower pace settles into a more measured rhythm or accelerates with the next group of launches.
How these figures are built
ADREC published the AED 117bn H1 result on 17 July 2026. Its public transaction table continues to receive historical additions and corrections. The table held 16,953 H1 sales worth AED 86.28bn when refreshed on 10 August, compared with 16,838 sales and AED 86.1bn in the original release.
The headline uses ADREC’s official release. Detailed breakdowns use the refreshed sales rows. A home means an apartment, villa, townhouse, duplex or penthouse. Price-per-square-foot medians use full-share sales with a recorded property area and remove zero or implausible rates. District and project names follow ADREC’s register.
Cite this research
For research, press or analyst citations, use: Projectory Research, “Abu Dhabi Property Market H1 2026: ADREC Data Report”, August 2026. The analysis covers Abu Dhabi real estate sales dated from 1 January through 30 June using ADREC data refreshed on 10 August 2026.
Sources
Projectory Research data
Download the H1 2026 aggregates
Downloadable CSV of the aggregated figures used in this report, covering official H1 transaction totals, refreshed H1 2025 and H1 2026 sales, off-plan and ready activity, home types, price bands, districts, monthly trends and named off-plan projects.
- Period
- H1 2026
- Coverage
- Abu Dhabi, United Arab Emirates
- Data refreshed
- 10 August 2026
The file contains grouped market statistics and no personal details or individual transaction records. Suggested citation: Projectory Research, Abu Dhabi Property Market H1 2026: ADREC Data Report, August 2026.
About the Projectory Team
Projectory’s editorial content is created and reviewed by its founders, who bring more than 30 years of combined experience brokering, buying, developing and selling property in the UAE.