19–25 October 2026: Dubai and Abu Dhabi Property Transactions Report
Abu Dhabi recorded 907 home sales, its second-busiest week since 2019. Dubai sales value fell 29.2%. Read Projectory’s 19–25 October property report.
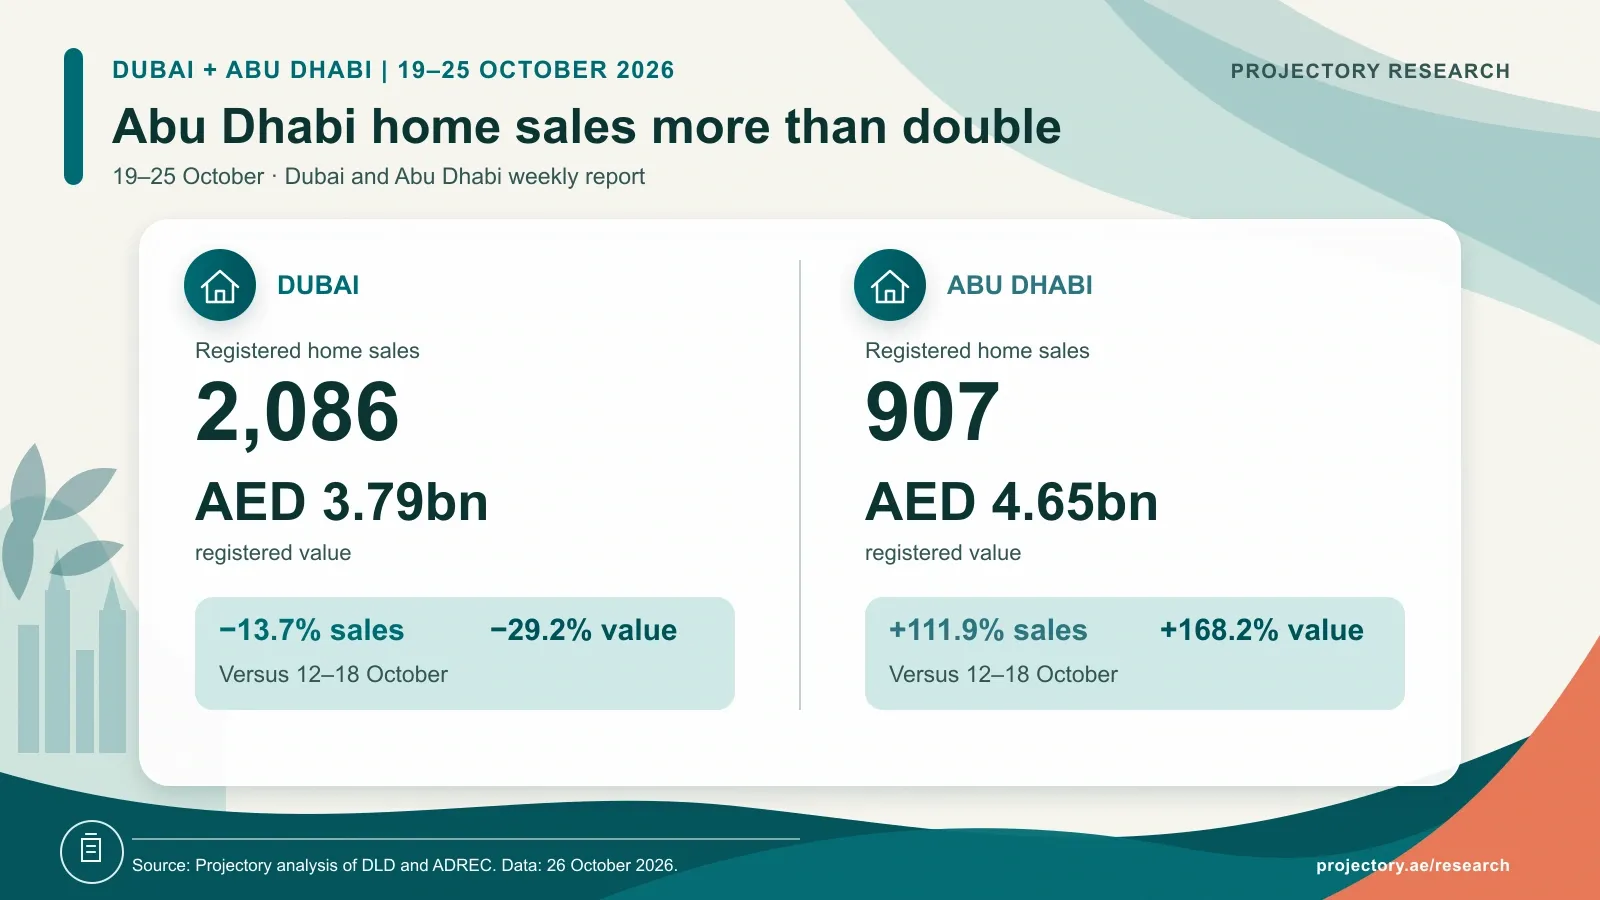
Abu Dhabi registered 907 home sales worth AED 4.65bn during 19–25 October, its second-busiest week in Projectory’s ADREC series since January 2019. A surge in Hudayriyat registrations lifted sales 111.9% and value 168.2% from the previous week.
Dubai recorded 2,086 home sales worth AED 3.79bn, down 13.7% in number and 29.2% in value. Fewer transactions at AED 10m or more accounted for more than half of the fall in spending.
The week at a glance
- Hudayriyat supplied 52.5% of Abu Dhabi’s home sales, with 476 registrations worth AED 3.17bn.
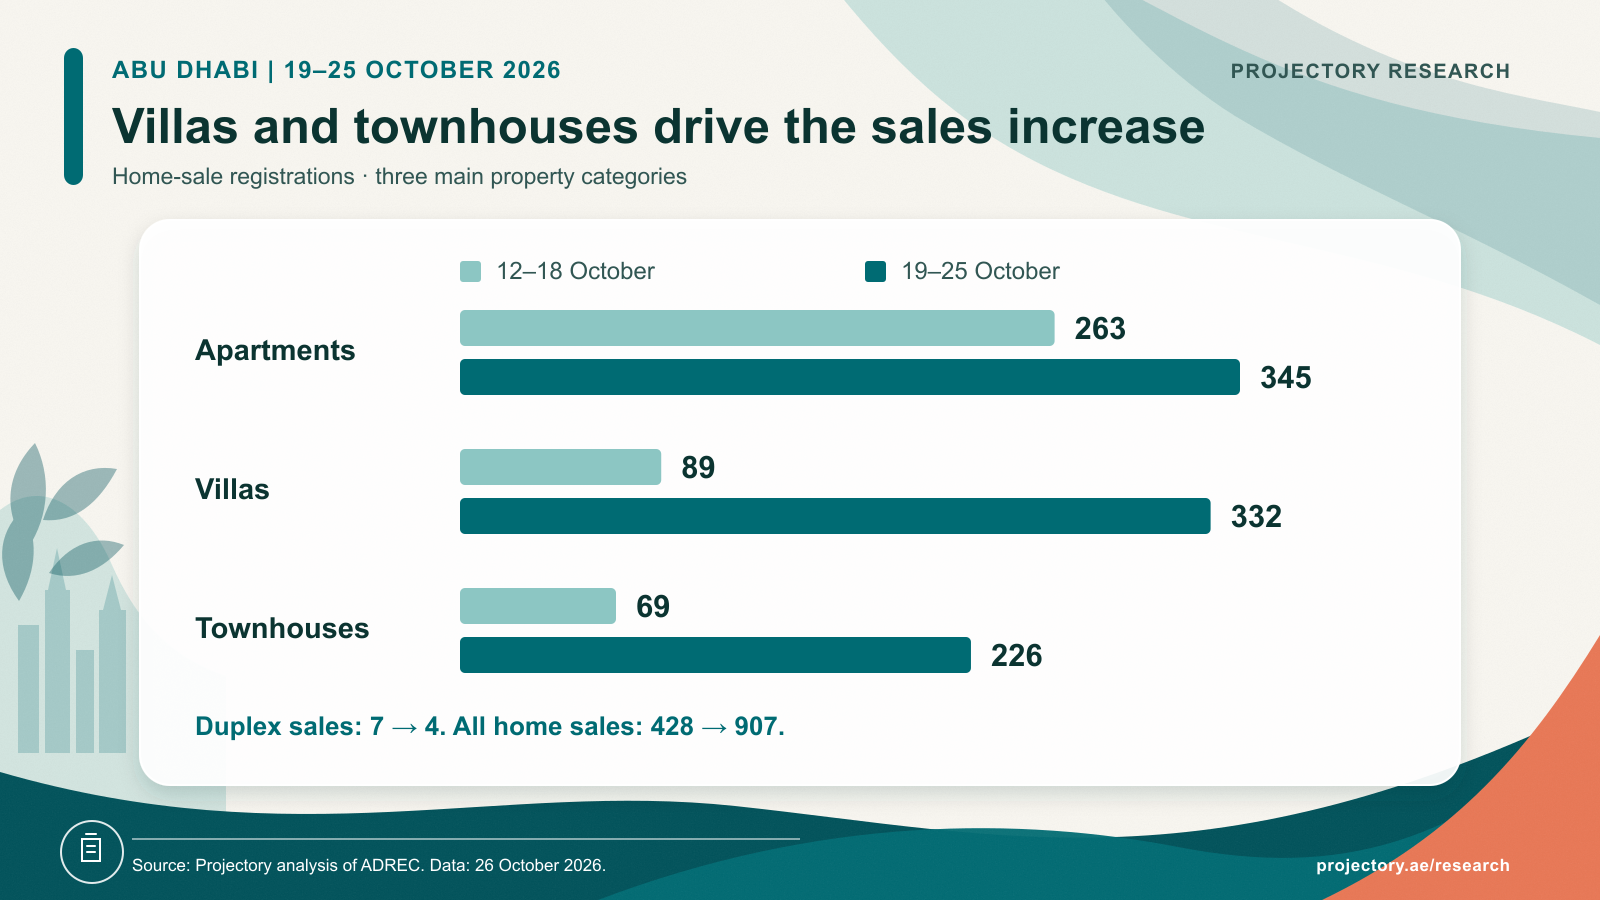
- Abu Dhabi townhouse sales reached 226, the highest weekly total in the available series.
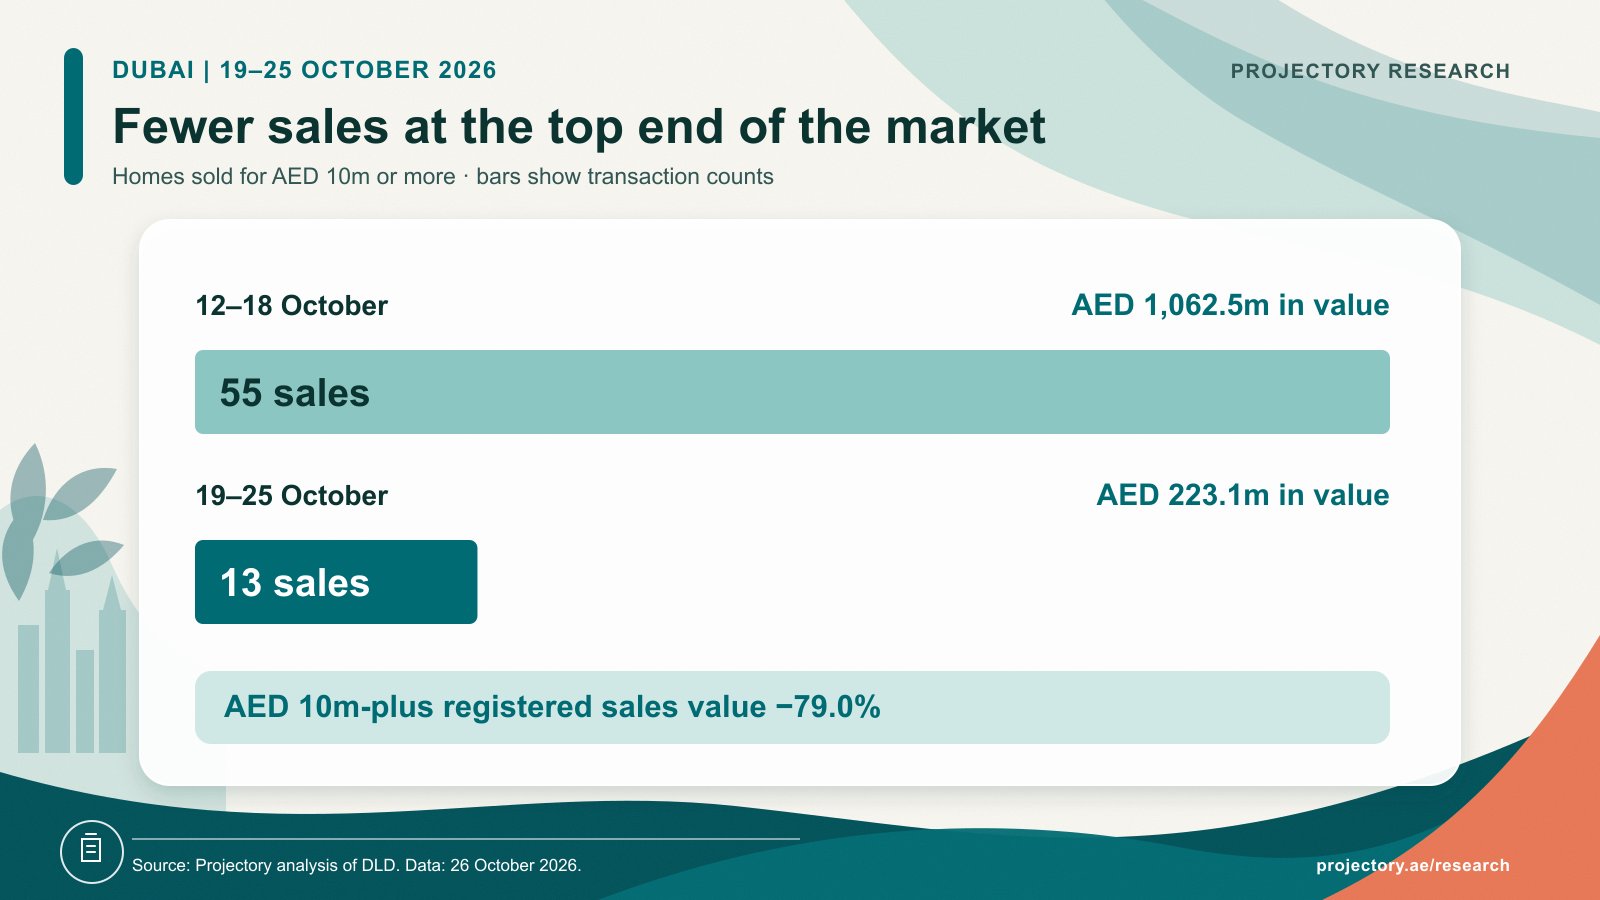
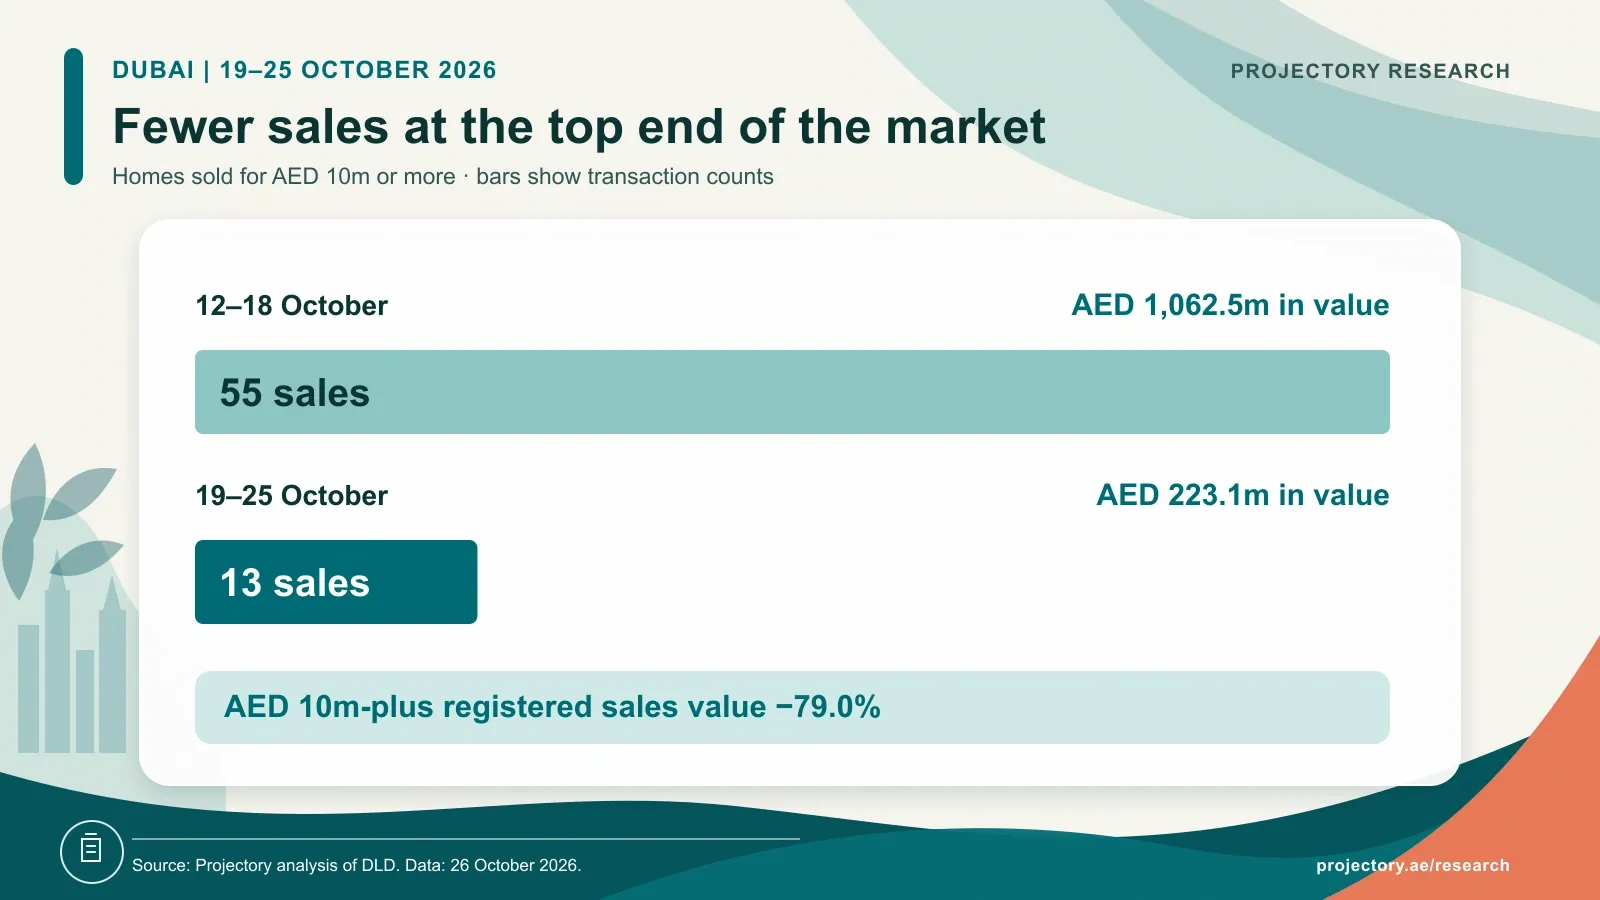
- Dubai’s AED 10m-plus sales fell from 55 to 13, reducing their share of home-sale value from 19.8% to 5.9%.
Compares 19–25 October with 12–18 October, using data available on 26 October.
Abu Dhabi: Hudayriyat drives the rise in registrations
Hudayriyat recorded 476 home sales, up from 33 a week earlier. Its additional 443 registrations accounted for 92.5% of Abu Dhabi’s increase in sales, while the area supplied 68.1% of the week’s home-sale value. Elsewhere in the emirate, sales rose from 395 to 431.
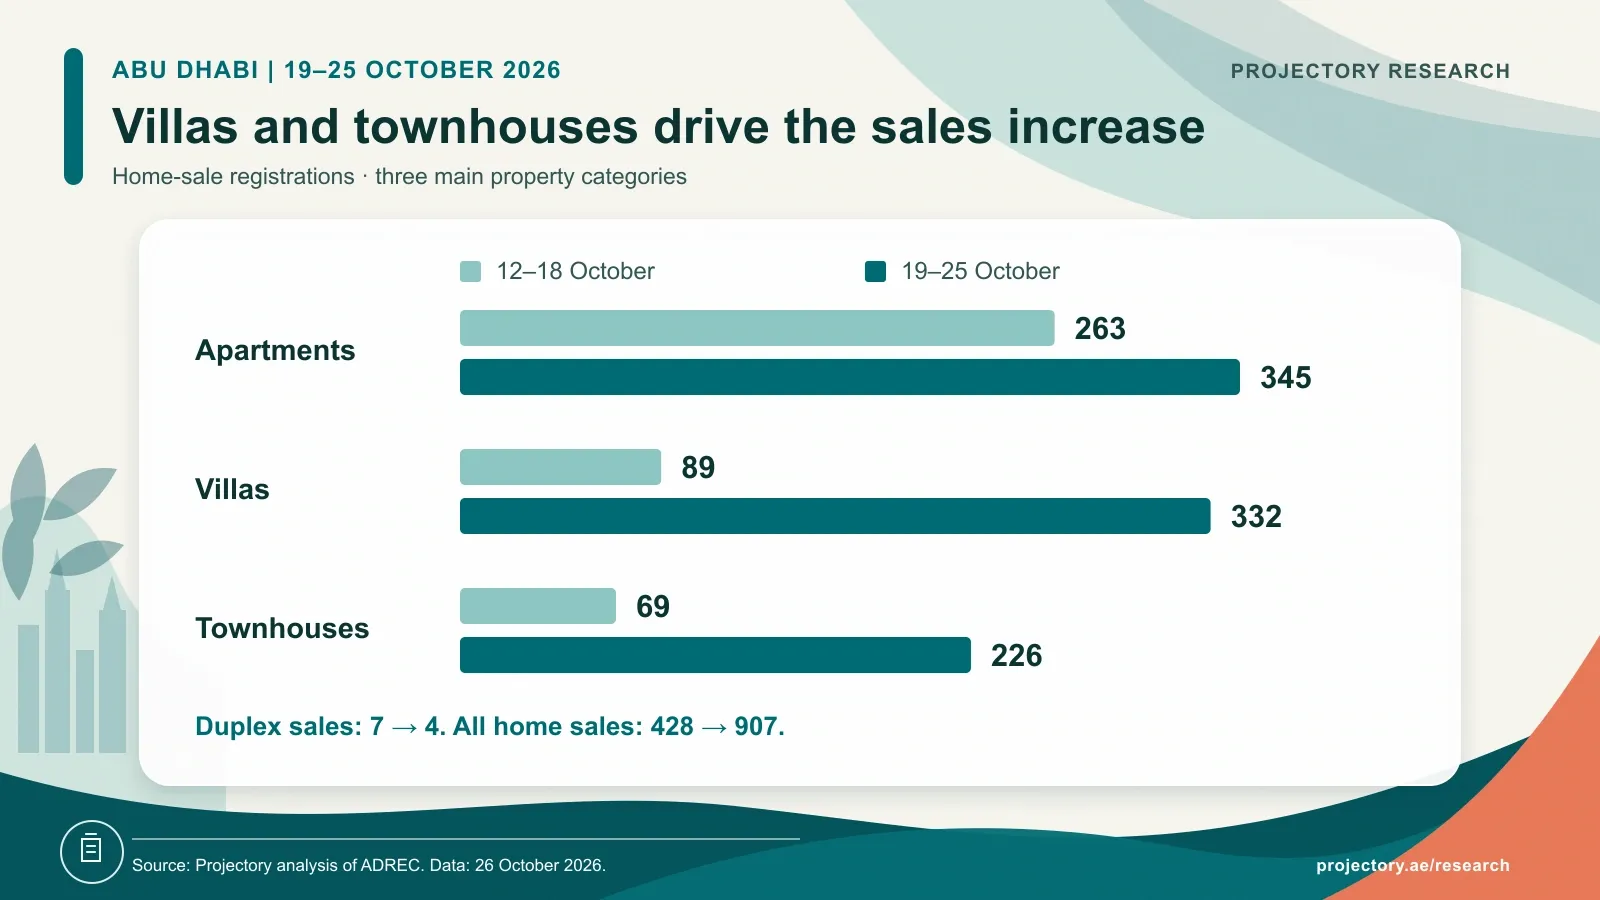
Villa registrations rose from 89 to 332, while townhouses increased from 69 to 226. Together they accounted for 61.5% of homes sold, compared with 36.9% the previous week. Apartment sales also increased, from 263 to 345.
Free to reuse with attribution. Credit and link to the original Projectory Research analysis.
Reuse termsThe townhouse total surpassed the previous weekly high of 217 in 21–27 December 2020. Only 23 February–1 March 2026, with 1,007 home sales, had a higher overall count than this week in the available history.
Off-plan homes accounted for 775 sales, or 85.4% of transactions, comprising 703 initial sales and 72 resales. The Canopies at Yas Point recorded 80 sales. Across the wider market, Yas Island had 131 registrations and Al Reem Island 113.
With more villas and townhouses changing hands, the median registered home price rose from AED 2.50m to AED 4.90m. This describes a more expensive mix of homes sold; it does not establish that the same properties increased in price. Registration dates can also cluster after buyers have agreed their purchases, so a single busy week needs to be read alongside the longer trend.
Dubai: fewer high-value sales pull down the total
Dubai’s 13 sales at AED 10m or more were worth AED 223.1m, compared with 55 worth AED 1.063bn the previous week. That reduction accounted for 53.6% of the fall in Dubai’s total home-sale value. Below AED 10m, sales value fell by a smaller 16.9%.
Both off-plan and ready-home sales counts fell by 13.7%. Off-plan homes still made up 67.6% of transactions, with 1,410 sales worth AED 2.43bn. Ready homes accounted for 676 sales worth AED 1.37bn; their value fell 41.8%, compared with 19.4% for off-plan homes.
Azizi Venice remained the busiest named development, with 143 sales worth AED 112.2m. Dubai South led the areas with 226 registrations, followed by Jumeirah Village Circle with 167. Across Dubai, 1,442 homes sold for less than AED 2m, representing 69.1% of transactions.
The largest registered home sale was a five-bedroom apartment at Balqis Residence for AED 55m, on 23 October.
About the data
This report covers 19–25 October 2026, compared with 12–18 October, using data available on 26 October. Both periods run from Monday to Sunday. Home totals exclude plots, whole residential buildings or complexes, and non-sale transactions. See our research methodology.
Comparison updates and calculation notes
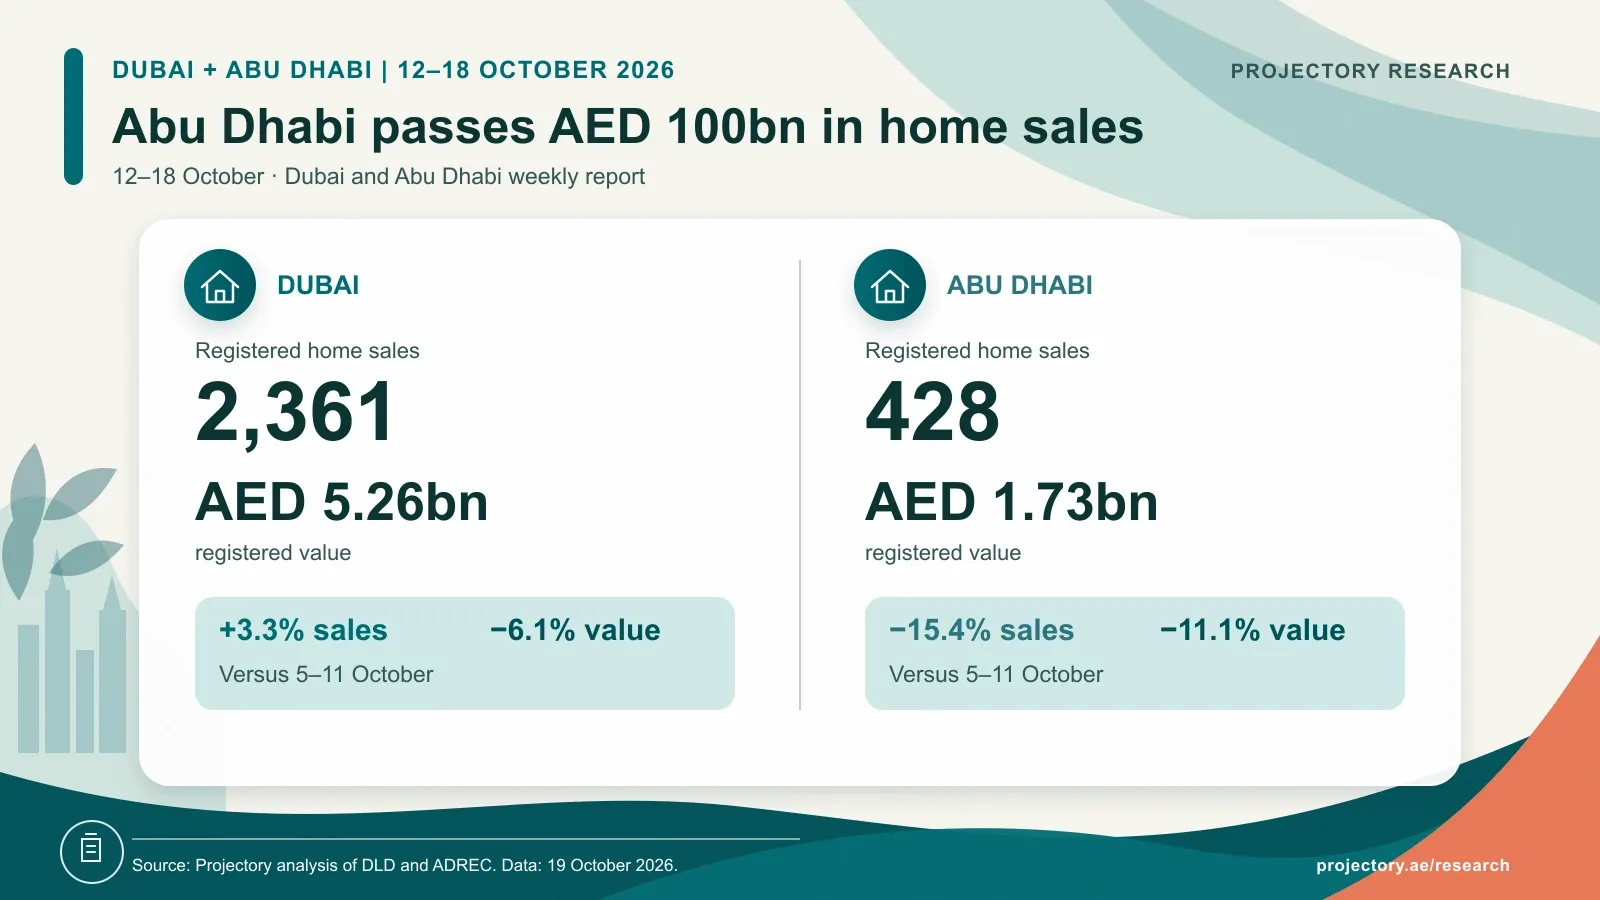
Dubai’s comparison has been refreshed to 2,416 homes worth AED 5.359bn, from 2,361 worth AED 5.255bn in the previous report. Abu Dhabi’s comparison remains 428 homes worth AED 1.734bn. Both weeks use the same source date and definitions.
The Dubai source extends to 26 October and Abu Dhabi to 25 October; only registrations dated within each reporting week are included. DLD CSV dates, values and registration status take priority where available, with verified source corrections retained. API-only sales use their recorded API facts. Original property classifications are preserved, and homes without a project name remain included in area and market totals.
Abu Dhabi’s historical comparisons cover 407 complete weeks from 7 January 2019 to 25 October 2026. Hudayriyat corresponds to ADREC’s Al Hidayriyyat area. Price-per-square-foot medians in the dataset use positive recorded areas for 1,910 Dubai homes and 900 Abu Dhabi homes. Later registrations and corrections may revise the figures.
Cite this research
Projectory Research, 19–25 October 2026: Dubai and Abu Dhabi Property Transactions Report, 26 October 2026, dataset version 1.0. Link to this report. Include the reporting period and data date when quoting figures.
Download the data
Download the aggregate CSV. Charts are available as reusable PNGs with their source data. Projectory’s original analysis, tables and graphics are available under CC BY 4.0.
Related research
- Previous weekly report: 12–18 October
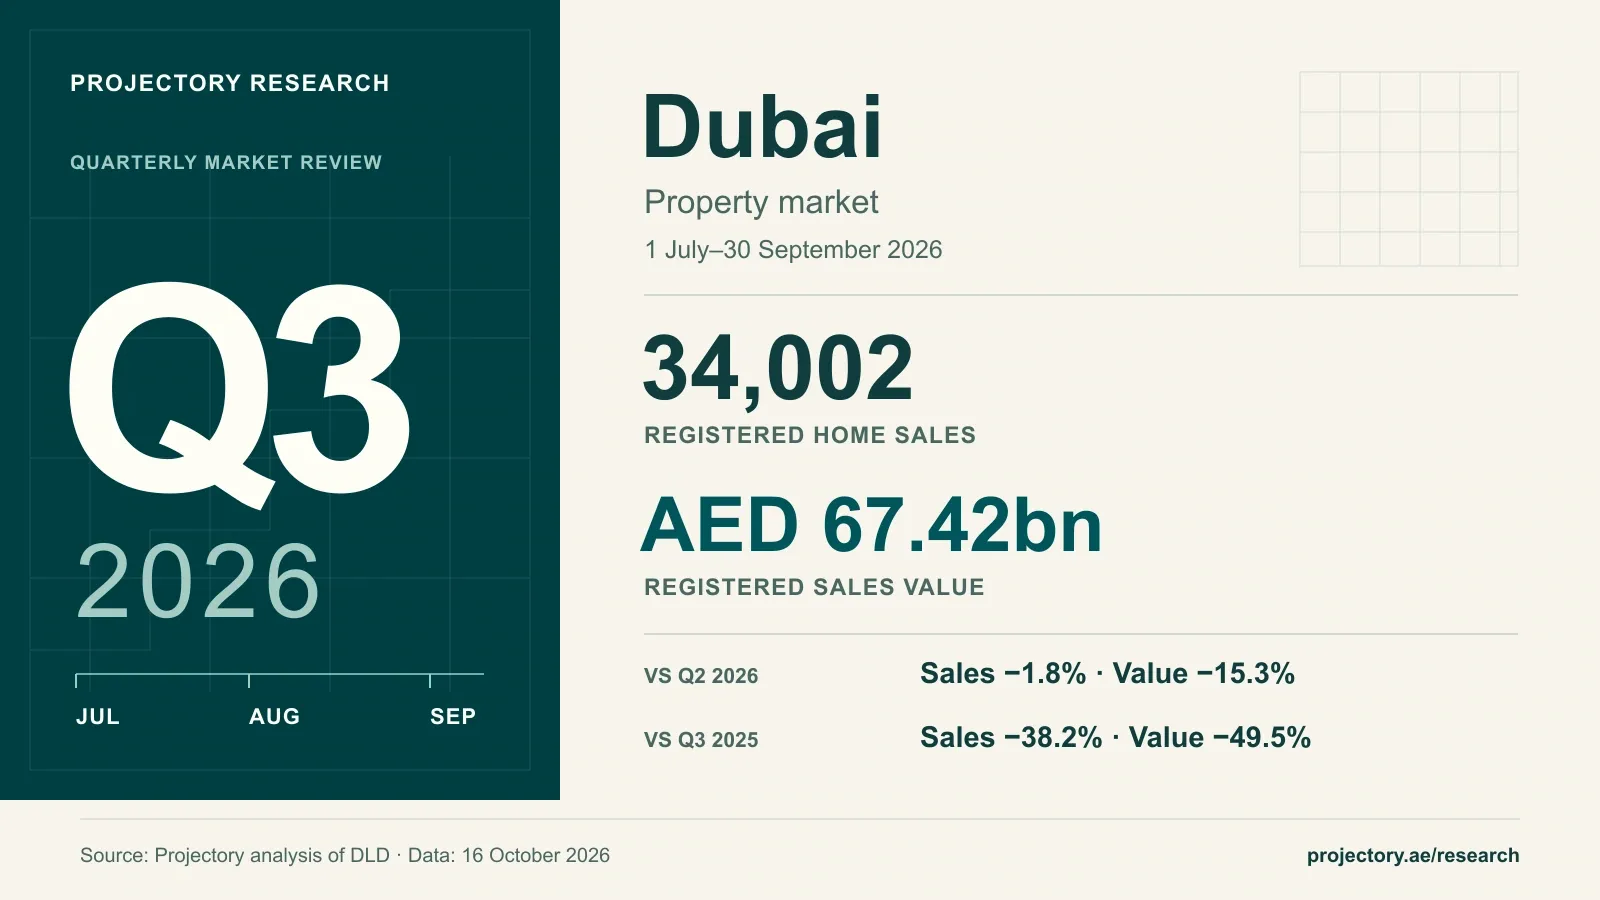
- Dubai’s Q3 report
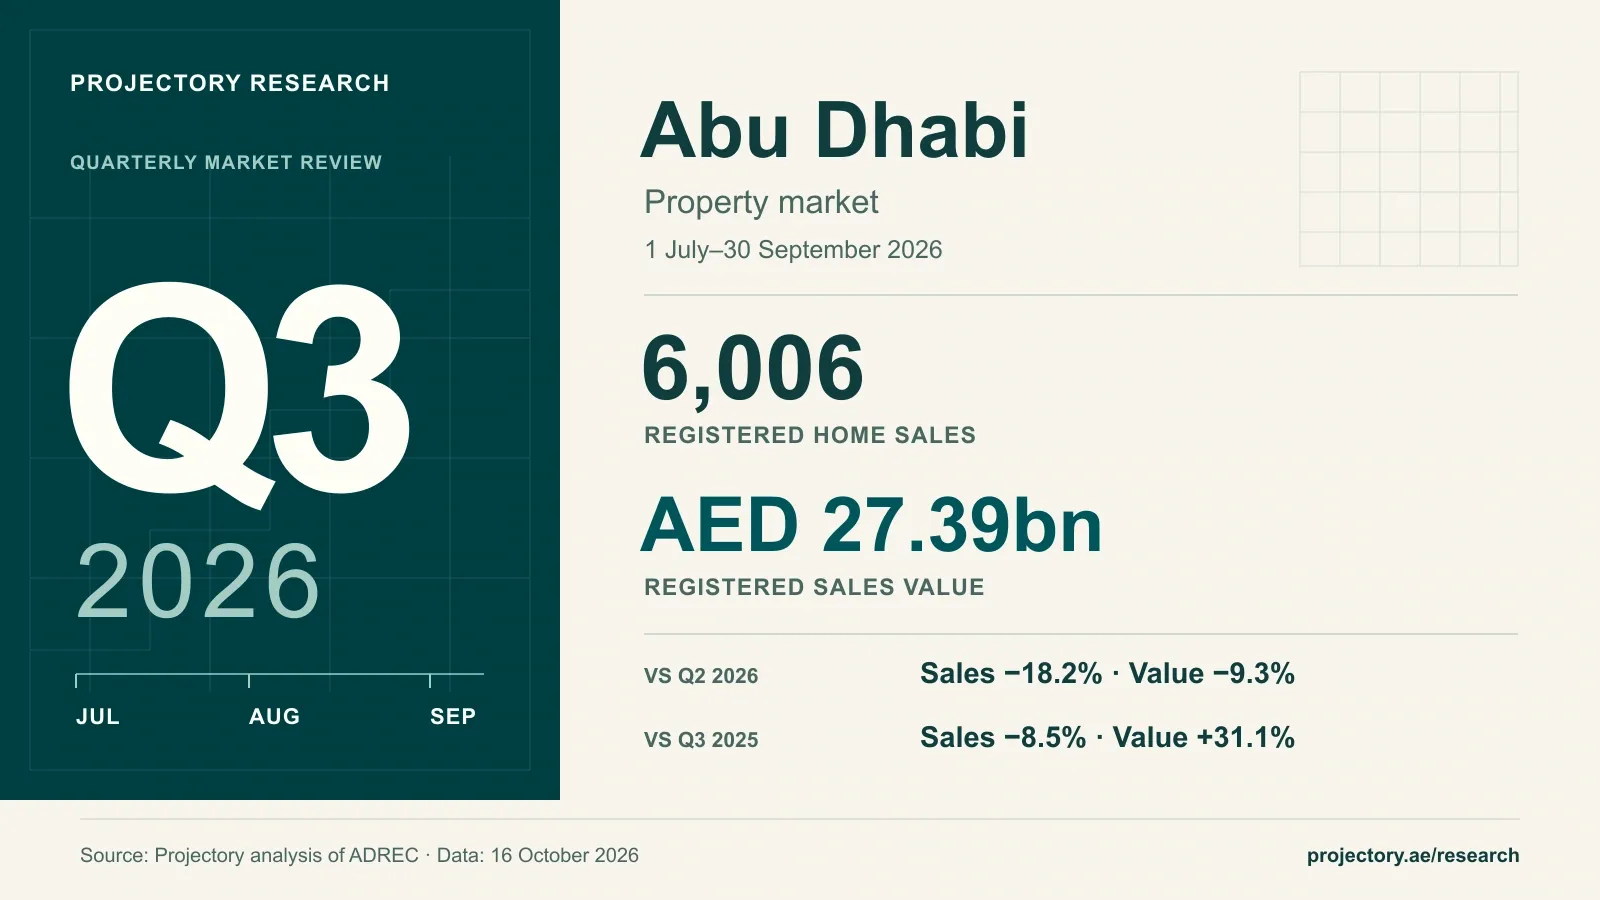
- Abu Dhabi’s Q3 report
- Browse Dubai transactions and Abu Dhabi transactions.
Sources
Projectory Research data
Download the report aggregates
Weekly home-sale totals and comparisons, off-plan and ready activity, property types, price bands, leading projects and areas, medians and historical weekly rankings.
- Period
- 2026-10-19/2026-10-25
- Versions
- Dataset 1.0 · Method 1.0
- Status
- Initial release
- Coverage
- Dubai and Abu Dhabi, United Arab Emirates
- Data refreshed
- 26 October 2026
The file contains grouped market statistics and no personal details or individual transaction records. Suggested citation: Projectory Research, 19–25 October 2026: Dubai and Abu Dhabi Property Transactions Report, 26 October 2026, dataset version 1.0.
The reuse licence applies to Projectory's original analysis, tables and graphics. Underlying government records remain subject to the source provider's terms.
Revision history
- Version 1.0 · — Initial release using data available on 26 October, with both weekly periods calculated consistently.
Co-founder and Head of Research
About Alex Lovell
Alex has 12 years of real estate experience in the UAE, helping international investors and family offices make informed property purchases through a data-driven approach.
View Alex Lovell on LinkedIn