Dubai Property Market Q3 2026: DLD Home Sales Report
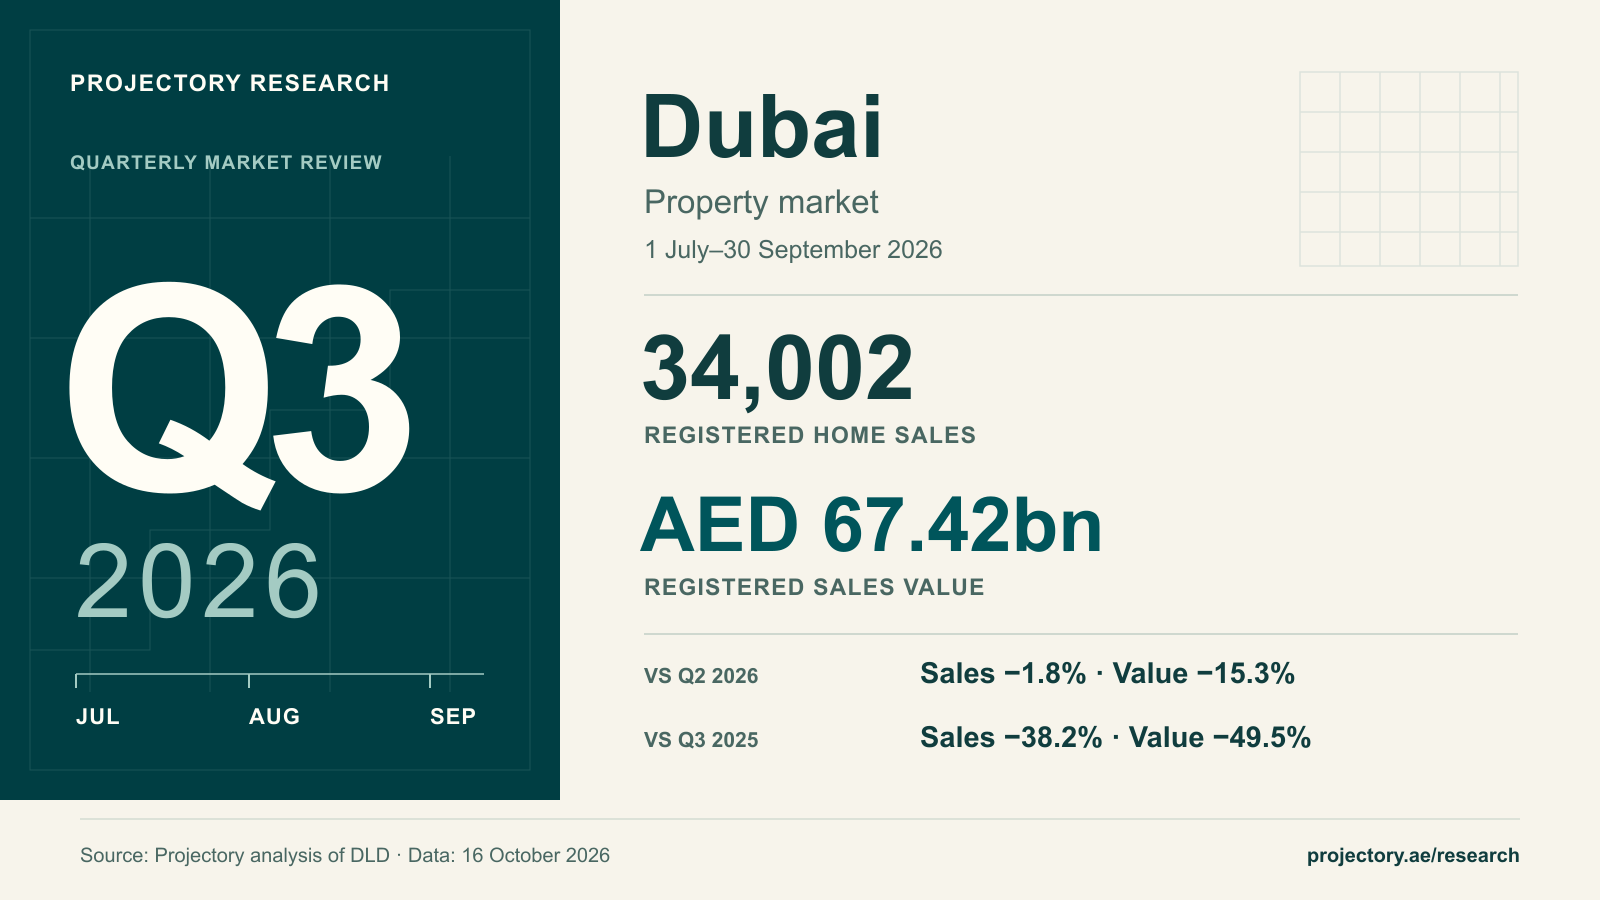
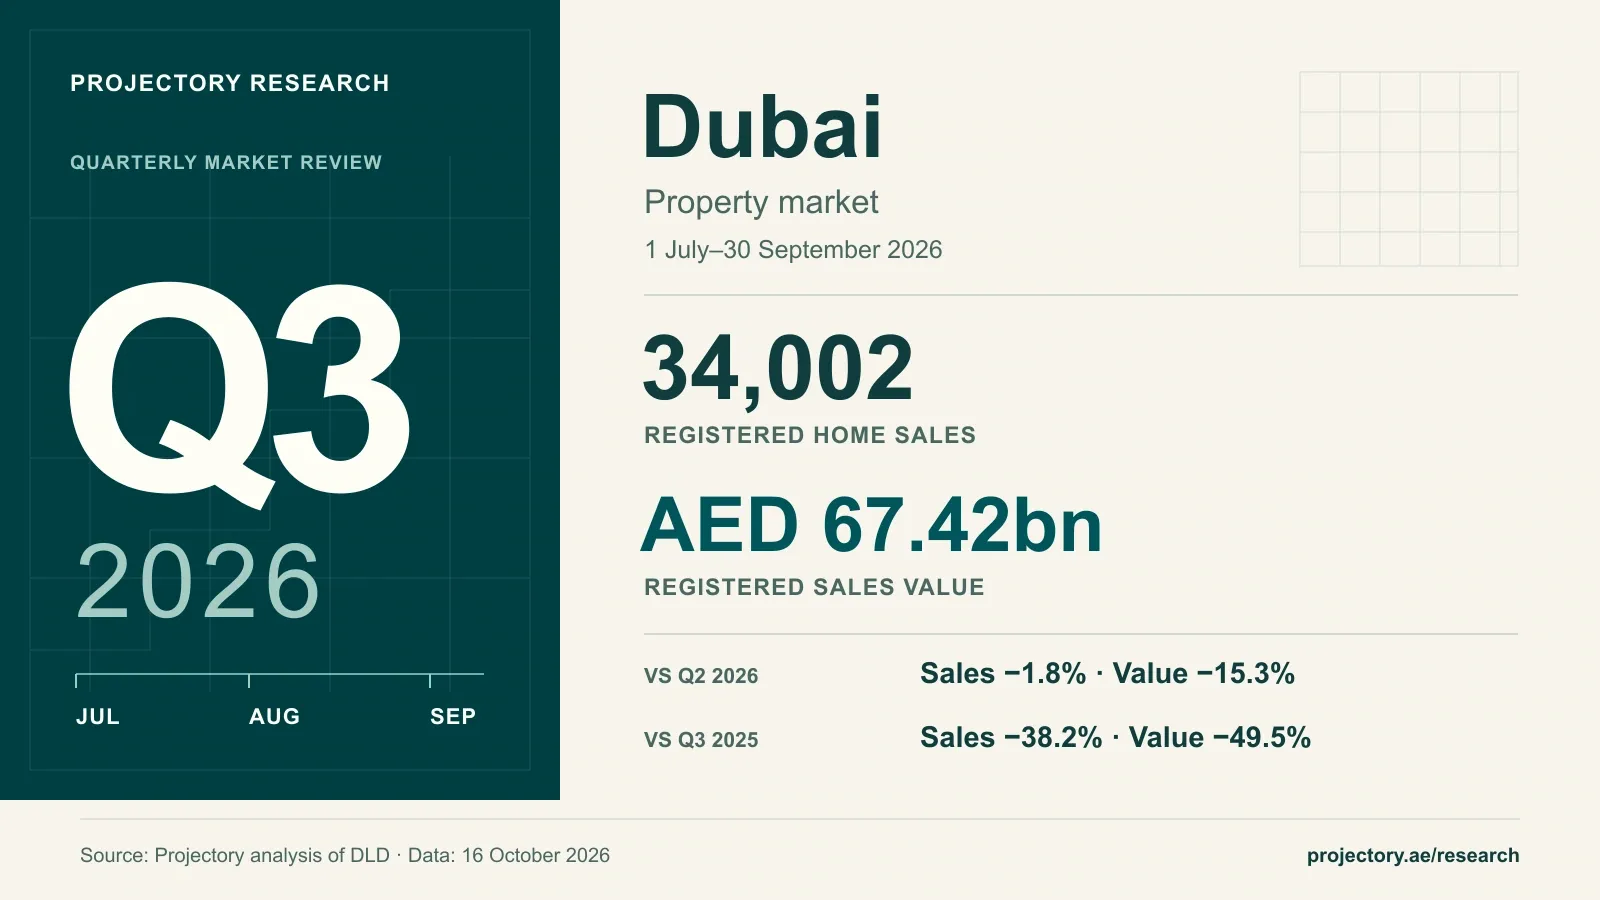
Dubai recorded 34,002 home sales worth AED 67.42bn in Q3 2026. DLD data show ready-home sales rose 25.4% from Q2 as off-plan activity slowed.
Dubai registered 34,002 home sales worth AED 67.42bn in the third quarter of 2026. Sales were 1.8% lower than in Q2, but their value fell 15.3% as off-plan activity slowed and a larger share of homes sold below AED 1m.
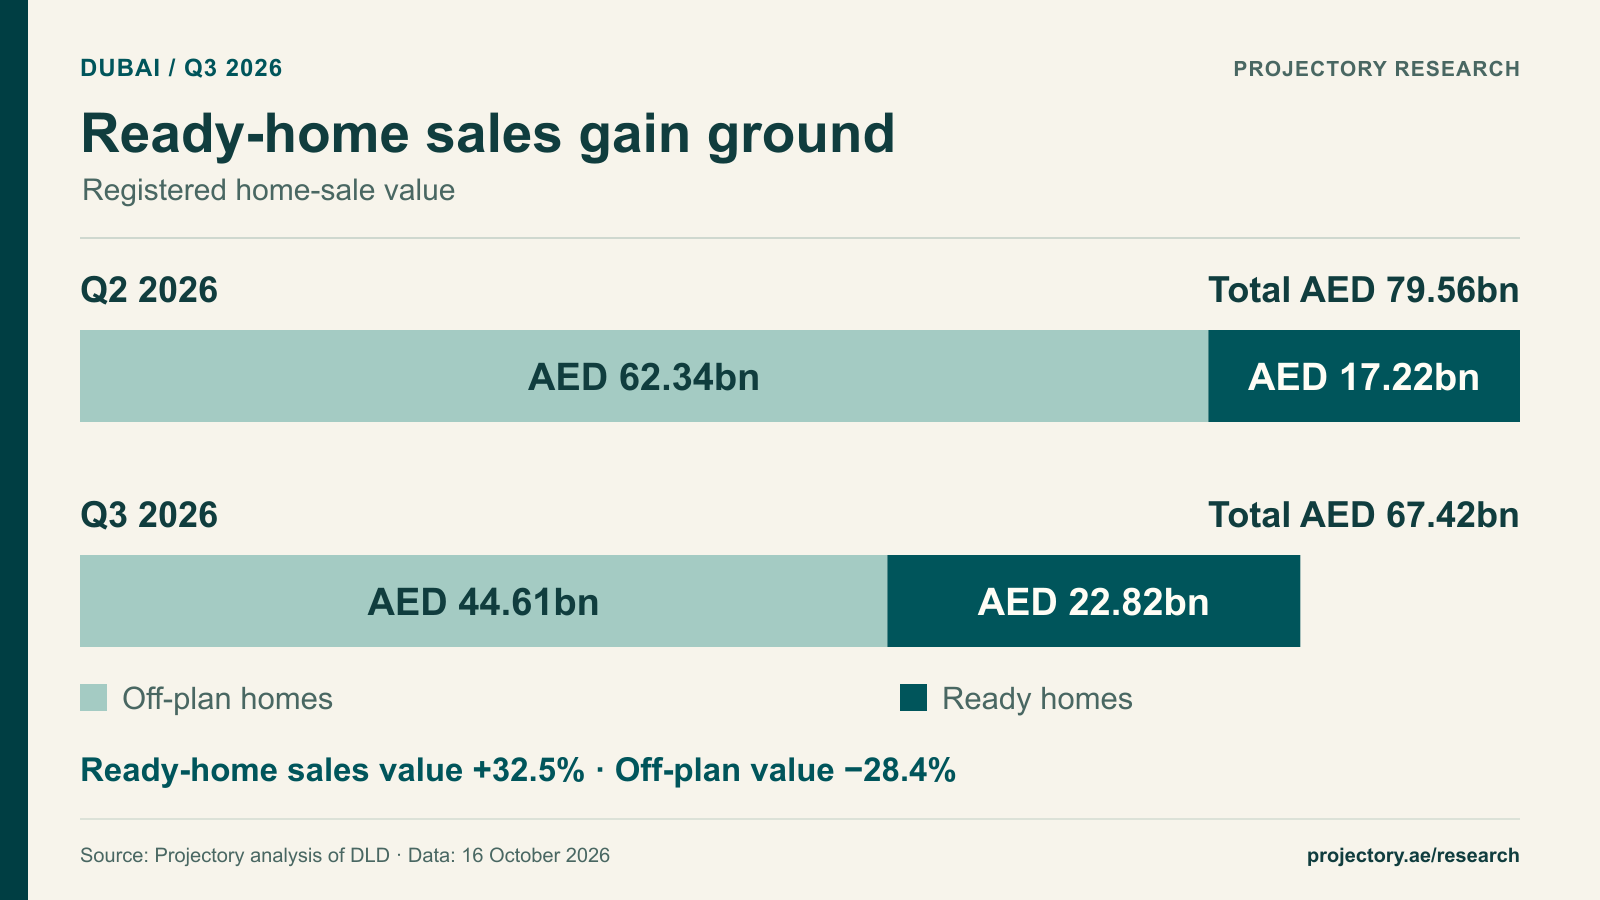
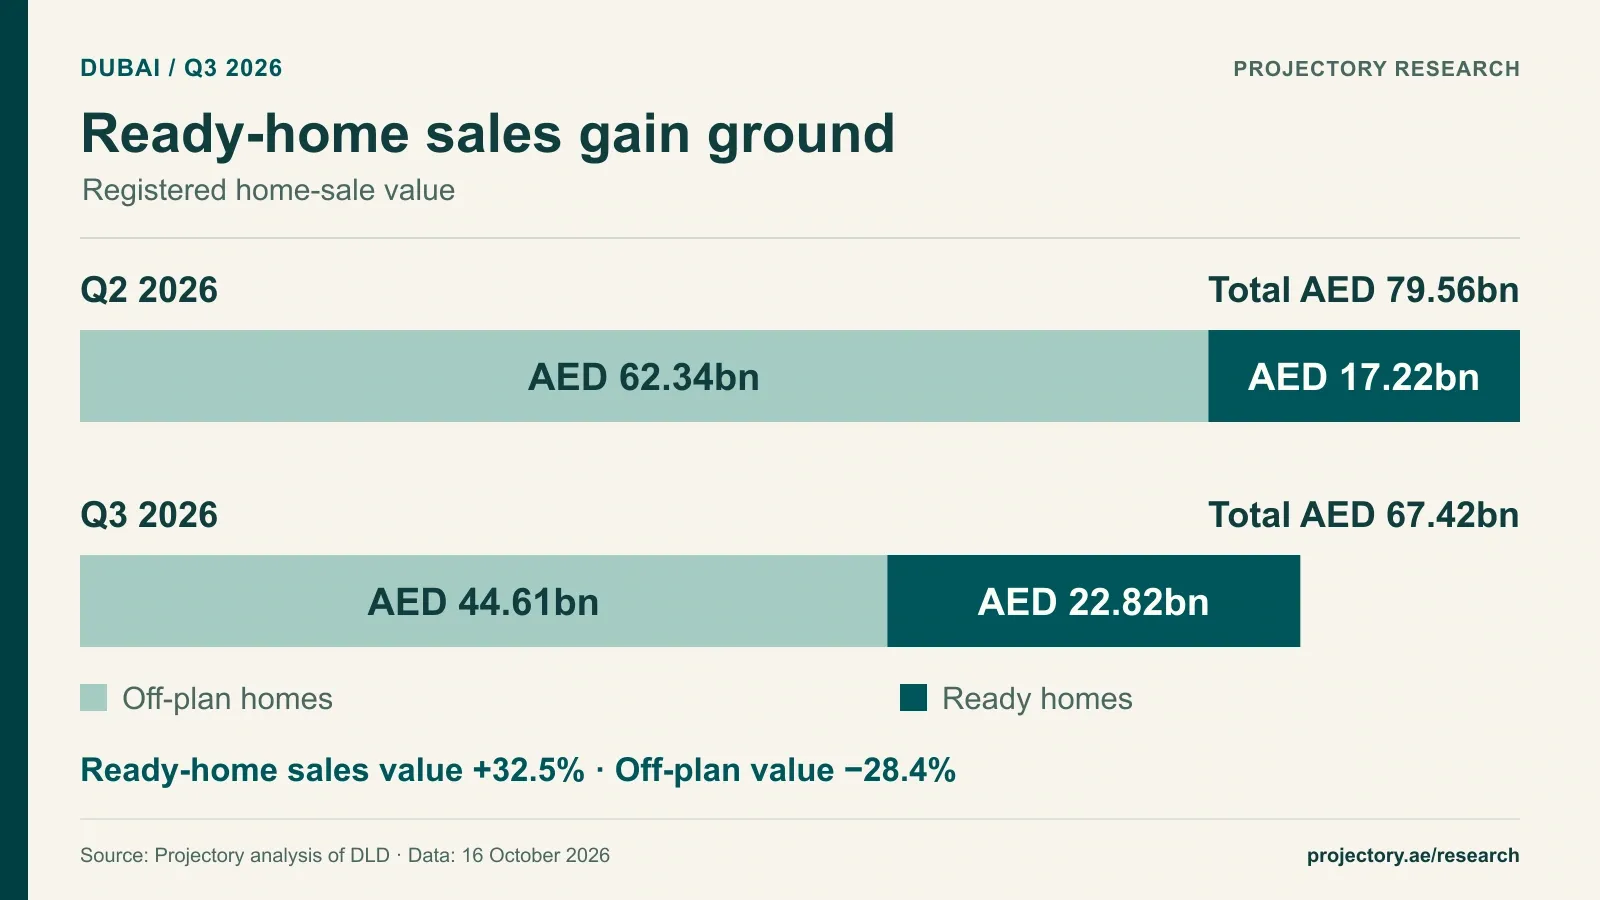
Completed homes had a stronger quarter. Ready-home sales rose 25.4%, with value increasing 32.5% to AED 22.82bn. Their growth kept the overall fall in transaction numbers modest.
Q3 at a glance
- Ready homes gained market share: 9,378 sales, representing 27.6% of transactions, up from 21.6% in Q2.
- Homes below AED 1m made up 41.4% of sales, compared with 35.1% in the previous quarter.
- Activity remained below last year: sales fell 38.2% and registered value fell 49.5% from Q3 2025.
Q3 covers July–September; Q2 covers April–June. Home sales exclude plots and whole residential assets. Data as at 16 October 2026.
Free to reuse with attribution. Credit and link to the original Projectory Research analysis.
Reuse termsCompleted homes offset much of the off-plan slowdown
Dubai recorded 1,900 more ready-home sales than in Q2, offsetting three-quarters of the 2,519-sale decline in off-plan registrations. Off-plan sales fell 9.3% to 24,624, while their combined value declined 28.4% to AED 44.61bn.
Ready homes accounted for 33.8% of total sales value, up from 21.6%. Off-plan homes still supplied nearly three-quarters of transactions, but fewer sales and a lower average transaction value reduced their contribution to the quarter’s total.
More sales below AED 1m
14,067 homes sold for less than AED 1m, compared with 12,150 in Q2. Activity at higher price points was quieter. Sales at AED 10m or more fell from 825 to 619, and their combined value declined from AED 19.44bn to AED 13.66bn.
The reduction in sales value at AED 10m or more accounted for 47.6% of the market’s total quarterly decline in value.
Azizi Venice and Dubai South led transaction numbers
Azizi Venice recorded 3,972 home sales worth AED 3.25bn, accounting for 11.7% of Dubai’s transactions. Its median registered price was AED 699,000, placing much of its activity towards the lower end of the city’s price range.
Dubai South led locations with 5,322 home sales, ahead of Jumeirah Village Circle with 2,430 and Downtown Jebel Ali with 1,830. Apartments supplied 30,365 registrations, or 89.3% of Dubai’s home sales.
Dubai home prices: the median fell 10.2%
The median registered price fell 10.2% from Q2 to AED 1.17m, alongside the larger share of sales below AED 1m. Median price per square foot declined by a smaller 1.4% to AED 1,673.
These medians describe the homes sold during each quarter. They do not show that an individual property lost 10.2% of its value. For a buyer or seller, recent sales of similar homes in the same development provide a closer comparison.
The first nine months of 2026
Across January–September, Dubai recorded 111,018 home sales worth AED 261.43bn. That was 24.0% fewer sales and 32.8% less value than in the same nine months of 2025.
About the data
Projectory analysed DLD home sales for 1 July–30 September 2026, using data available on 16 October. Comparisons cover Q2 2026 and Q3 2025, with matching January–September periods for year-to-date figures. Plots, whole residential assets and non-sale transactions are excluded. See our research methodology.
Calculation notes
DLD’s downloadable records take precedence for transaction dates, values and registration status; sales absent from those records use DLD’s API facts. Eligible villa sales recorded under land categories remain included. Homes without a project name are also counted. All comparison periods use the latest available records, so totals can differ from earlier monthly reports. Price-per-square-foot medians cover 32,859 Q3 homes with usable size information. Further registrations or corrections may revise the figures.
The AED 10m-or-more contribution is that band’s change in sales value divided by the change in total home-sale value. Both inputs are included in the aggregate CSV.
Cite this research
Projectory Research, Dubai Property Market Q3 2026: DLD Home Sales Report, 16 October 2026, dataset version 1.0. Link to this report. Please include the reporting period and data date when quoting figures.
Download the data
Download the aggregate CSV. The quarterly cover and comparison chart are available to reuse with attribution. Projectory’s original analysis, tables and graphics are available under CC BY 4.0; see the methodology and reuse terms.
Related research
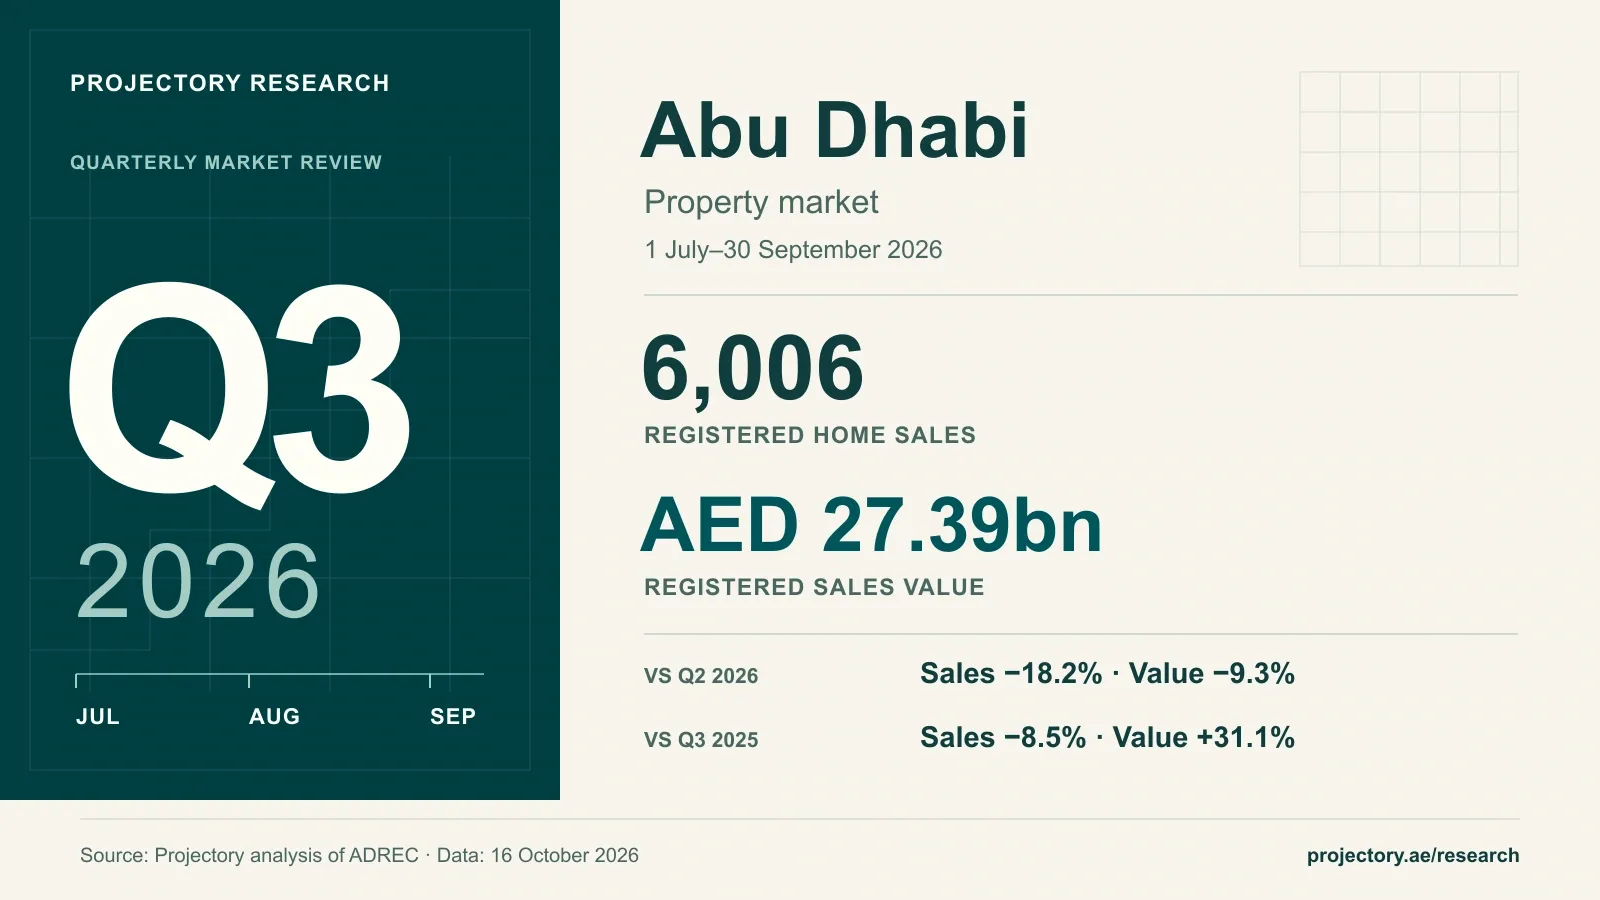
- Abu Dhabi’s Q3 report
- Dubai’s September report
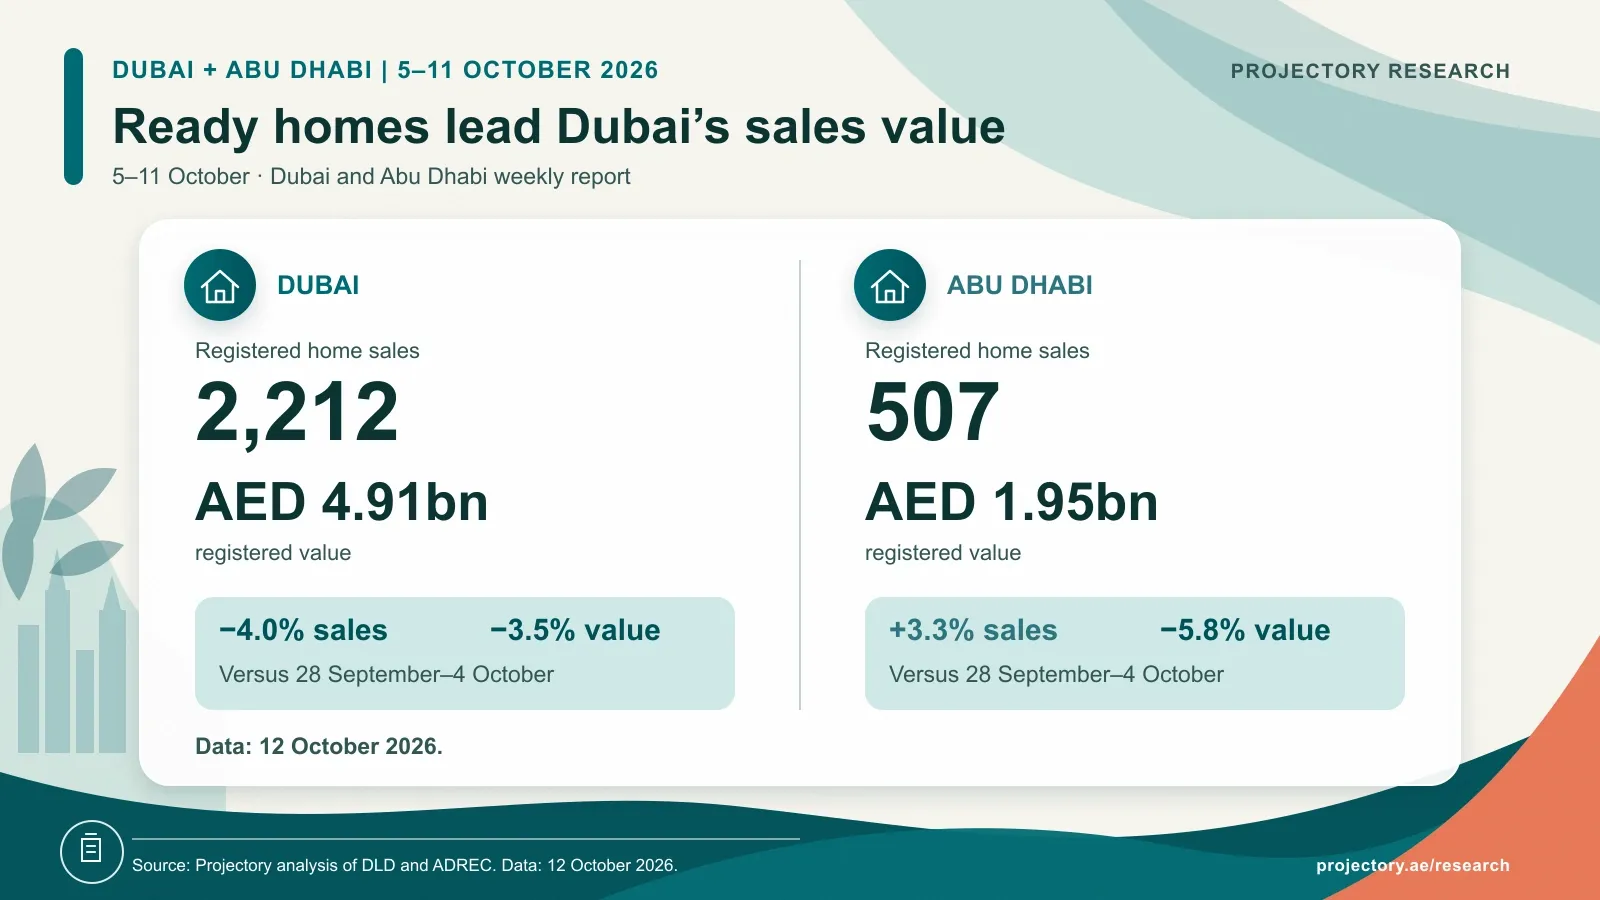
- 5–11 October weekly report
- Explore Dubai transactions
Sources
Projectory Research data
Download the report aggregates
Quarterly home-sale totals, comparisons with Q2 2026 and Q3 2025, off-plan and ready activity, property types, price bands, leading projects and areas, price medians and January–September comparisons.
- Period
- 2026-07-01/2026-09-30
- Versions
- Dataset 1.0 · Method 1.0
- Status
- Initial release
- Coverage
- Dubai, United Arab Emirates
- Data refreshed
- 16 October 2026
The file contains grouped market statistics and no personal details or individual transaction records. Suggested citation: Projectory Research, Dubai Property Market Q3 2026: DLD Home Sales Report, 16 October 2026, dataset version 1.0.
The reuse licence applies to Projectory's original analysis, tables and graphics. Underlying government records remain subject to the source provider's terms.
Revision history
- Version 1.0 · — First quarterly edition, using the latest available registrations and consistent comparison periods.
Co-founder and Head of Research
About Alex Lovell
Alex has 12 years of real estate experience in the UAE, helping international investors and family offices make informed property purchases through a data-driven approach.
View Alex Lovell on LinkedIn