Dubai Property Market September 2026: DLD Home Sales Report
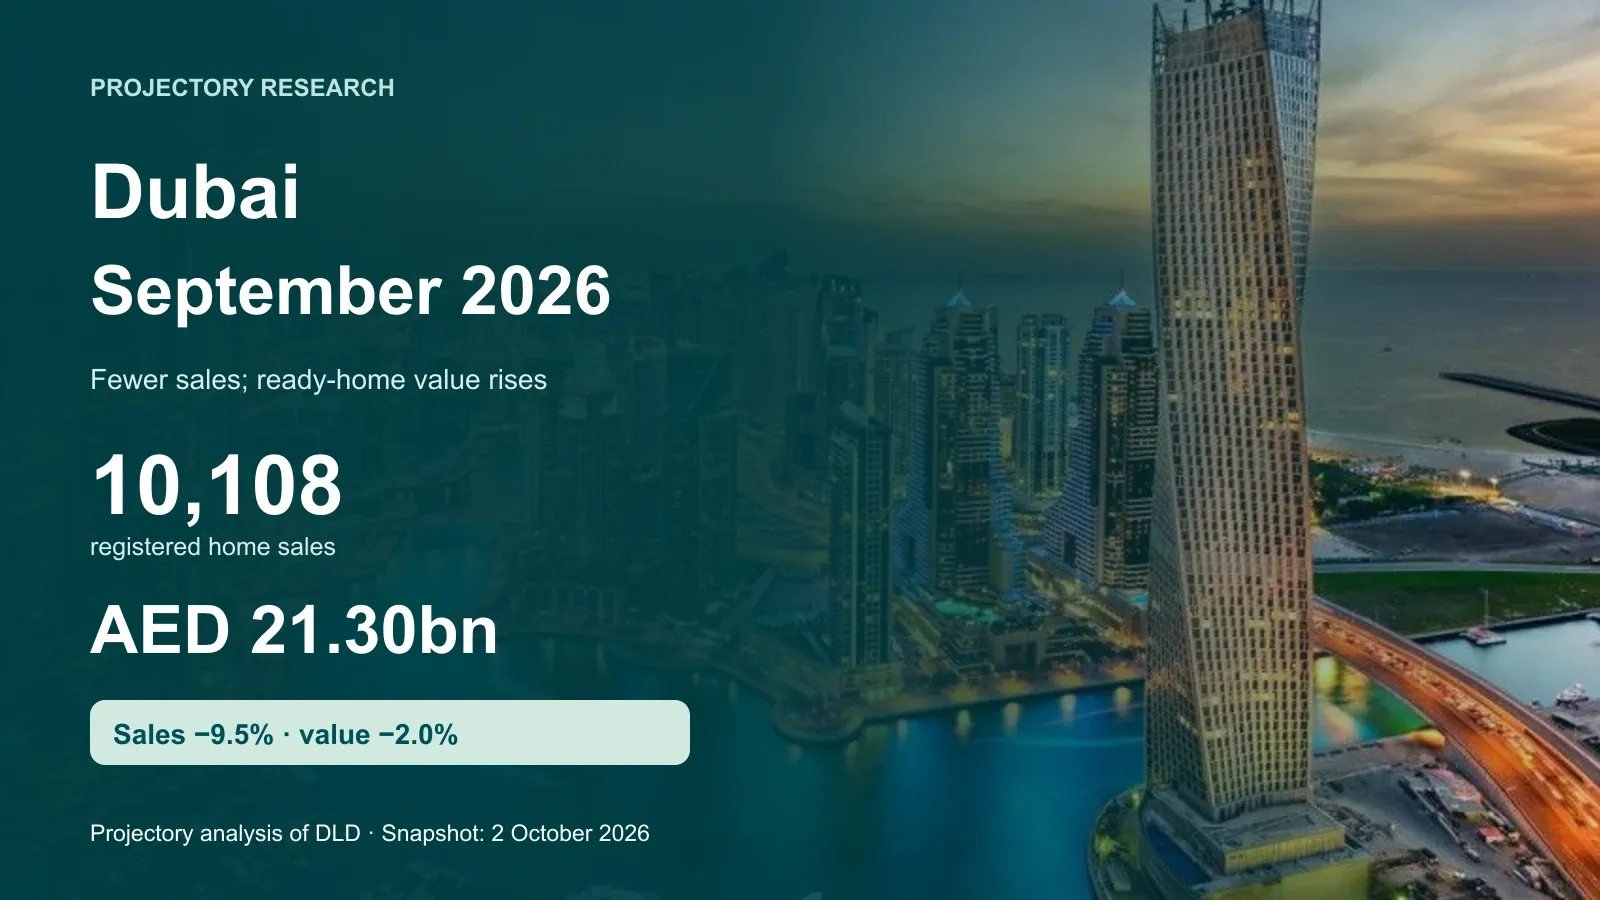
Dubai registered 10,108 home sales worth AED 21.30bn in September. Sales fell 9.5% from August; ready-home value rose 40.3%.
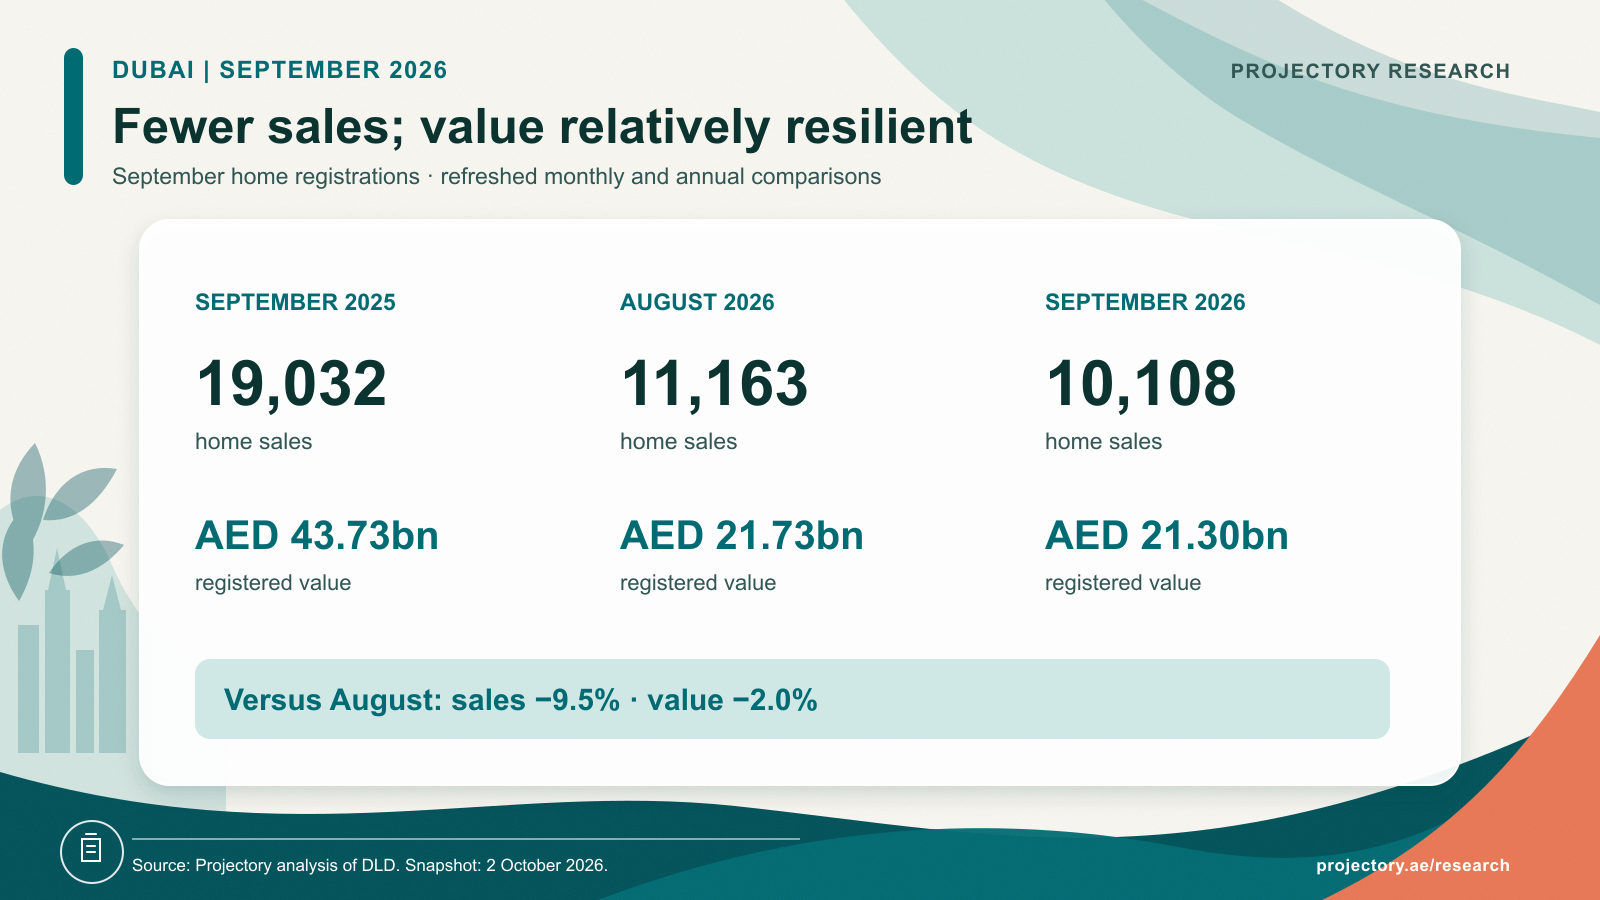
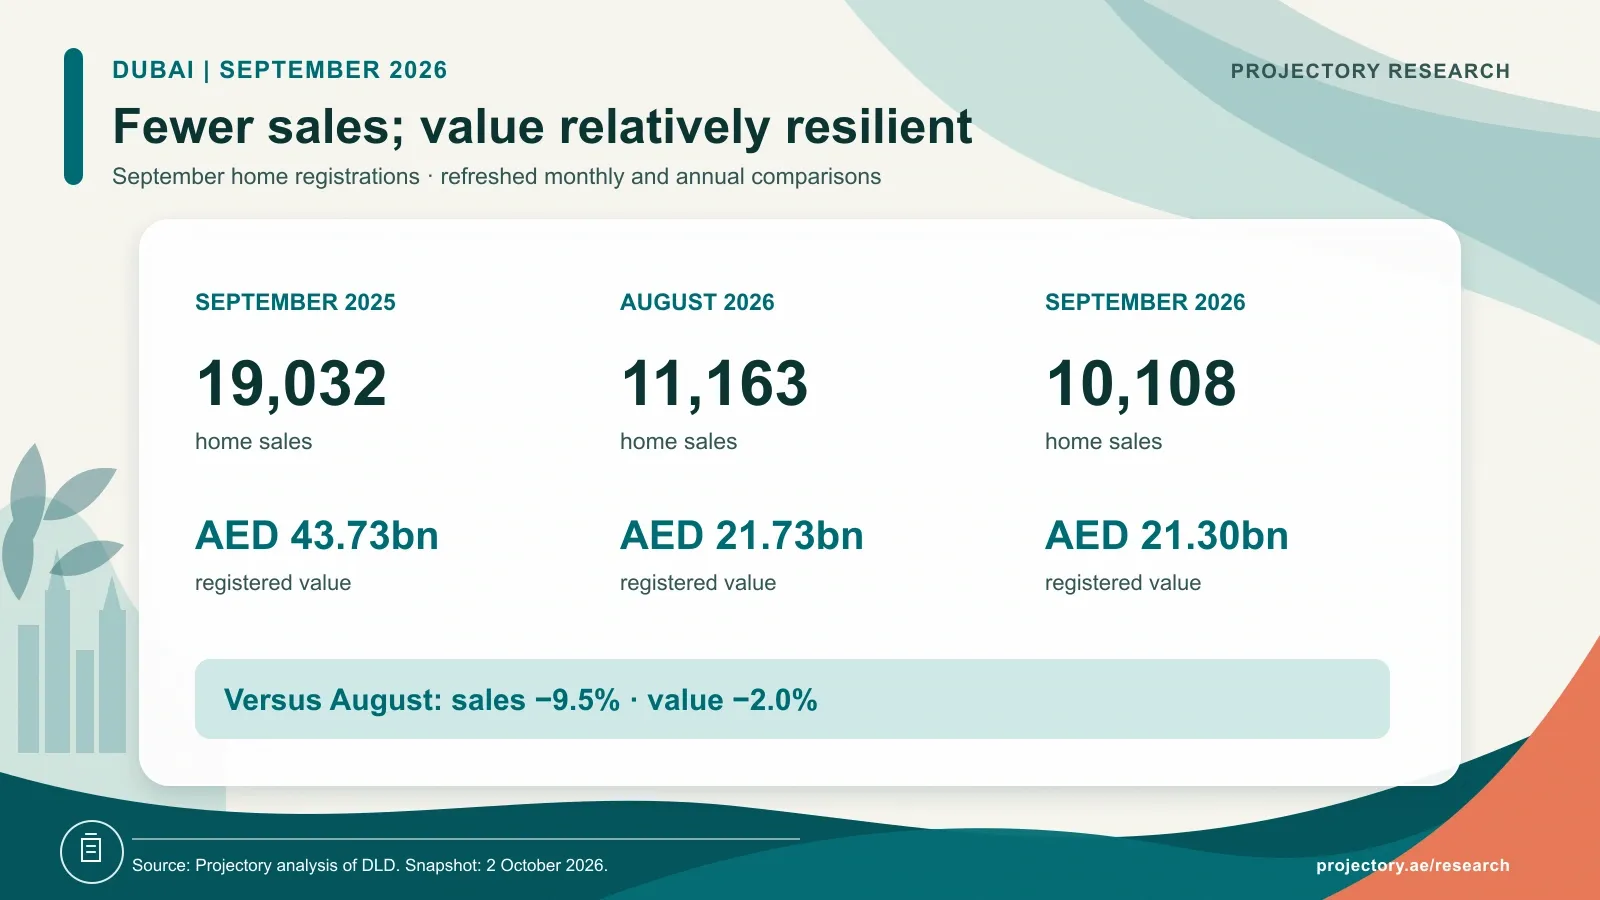
Dubai registered 10,108 home sales worth AED 21.30bn in September 2026. Sales fell 9.5% from August, while registered value eased by a smaller 2.0%.
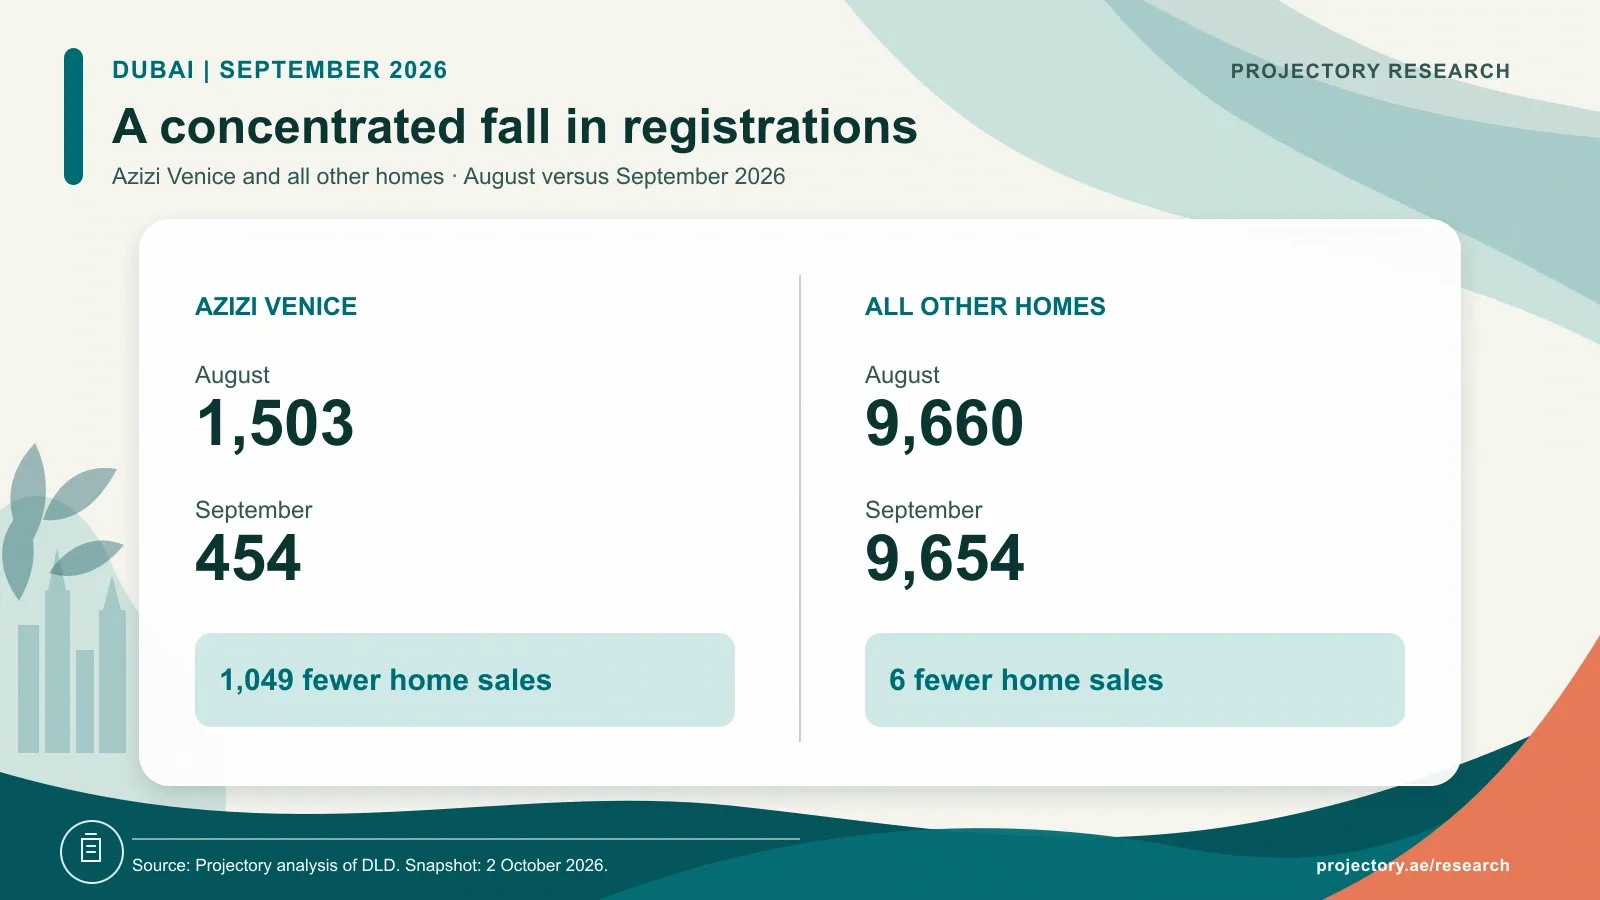
Two shifts explain the gap. Azizi Venice recorded 1,049 fewer sales, almost matching Dubai’s overall decline of 1,055, while sales across the rest of the city were broadly unchanged. At the same time, the value of completed-home sales rose 40.3%, offsetting much of the fall in off-plan activity.
September at a glance
- Ready homes gained ground: 3,148 sales worth AED 9.04bn, up 8.3% in count from August.
- Off-plan still led volume: 6,960 homes, or 68.9% of registrations, down from 73.9% in August.
- The annual comparison remained weaker: sales were 46.9% below September 2025 and registered value 51.3% lower.
Home sales only; excludes plots and whole residential buildings. Data as at 2 October 2026.
Free to reuse with attribution. Credit and link to the original Projectory Research analysis.
Reuse termsOne development accounted for most of the monthly fall
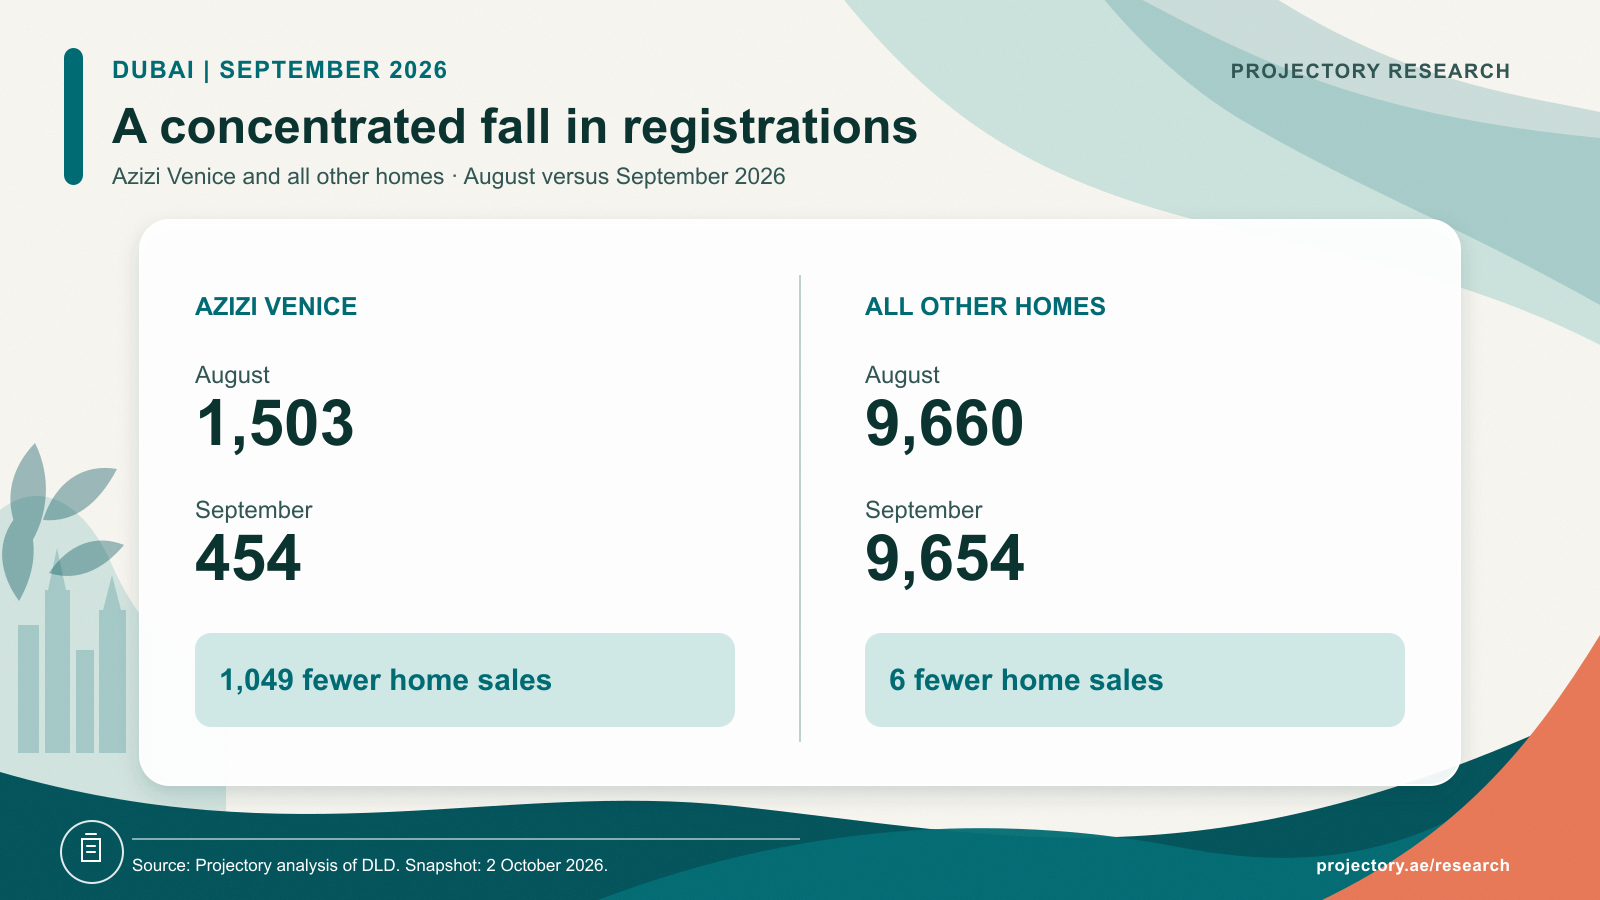
Azizi Venice remained Dubai’s busiest development, with 454 homes worth AED 373.5m, but registrations were 69.8% below August’s 1,503. The rest of Dubai recorded 9,654 homes, versus 9,660 in August.
The headline decline therefore overstates how widely sales slowed across Dubai. Other developments had their own rises and falls, but together they recorded almost exactly the same number of sales as in August. The figures show where the monthly decline occurred, without establishing what drove the change at Azizi Venice.
Free to reuse with attribution. Credit and link to the original Projectory Research analysis.
Reuse termsValia followed with 263 homes worth AED 725.4m, ahead of Binghatti Skyterraces with 253. Dubai South led locations with 842 sales, followed by Jumeirah Village Circle with 784 and Majan with 523.
Completed homes helped sales value hold up
Off-plan sales fell 15.7% to 6,960, and their registered value declined 19.8% to AED 12.27bn. Ready-home value rose from AED 6.44bn to AED 9.04bn, increasing its share of total value from 29.6% to 42.4%. With ready-home sales rising 8.3% by number, their much faster growth in value also points to a more expensive mix of completed homes changing hands.
Apartments supplied 8,830 registrations and villas 1,278. The largest individual home sale was a six-bedroom ready villa at Eome on Palm Jumeirah for AED 260m, dated 1 September.
What the price figures mean
The median registered home price rose 10.7% from August to AED 1.28m, while median price per square foot fell 3.1% to AED 1,639. Those opposing movements underline how much the headline price depends on the homes sold that month. A higher median sale price can accompany a lower price per square foot when the mix of sizes, locations and property types changes. For buyers, recent sales of comparable homes offer a more useful guide to value.
The longer view remained weaker than last year. January–September recorded 111,026 homes worth AED 261.43bn, compared with 146,001 worth AED 389.18bn in the same nine months of 2025. September’s relatively steady monthly value should be read against that wider slowdown.
Projectory’s take: Dubai’s monthly decline was less widespread than the headline suggests: sales outside Azizi Venice were almost unchanged, and completed homes attracted a larger share of sales value. That resilience did not erase the sizeable gap with 2025, making the distinction between a steady month and a weaker year essential.
About the data
Projectory analysed Dubai Land Department home sales for 1–30 September 2026, using data available through 2 October. Comparisons cover August and September 2025; year-to-date totals cover January–September in each year. Home totals exclude plots, whole residential buildings and non-sale transactions. See our research methodology for definitions.
Comparison updates and calculation notes
Later registrations and corrections bring August to 11,163 home sales worth AED 21.73bn, compared with 11,147 worth AED 21.43bn in the original report. This article uses the updated figures throughout.
DLD’s downloadable records take precedence where available; additional sales use DLD’s API records. Villa sales recorded under land categories are included where matched to villa inventory. Homes without a project name remain in the totals, and matching development names are combined. Off-plan figures include both initial sales and resales. The price-per-square-foot median covers 9,662 September homes with usable size information. Figures may change as further registrations or corrections become available.
Cite this research
Projectory Research, Dubai Property Market September 2026: DLD Home Sales Report, 2 October 2026, dataset version 1.0. Link to this report. Please include the reporting period and data date when quoting these figures.
Download the data
Download the aggregate CSV. Charts are available to download or embed, with their source data included. Original analysis and statistical graphics are available under CC BY 4.0; see the methodology and reuse terms.
Related research
- Dubai’s August report
- Abu Dhabi’s September report
- 21–27 September weekly report
- Explore Dubai transactions
Sources
Projectory Research data
Download the report aggregates
Home-sale totals, period comparisons, sale-status and property-type splits, price bands, leading projects and areas, medians and comparison revisions. Includes annual and January–September comparisons.
- Period
- 2026-09-01/2026-09-30
- Versions
- Dataset 1.0 · Method 1.0
- Status
- Initial release
- Coverage
- Dubai, United Arab Emirates
- Data refreshed
- 2 October 2026
The file contains grouped market statistics and no personal details or individual transaction records. Suggested citation: Projectory Research, Dubai Property Market September 2026: DLD Home Sales Report, 2 October 2026, dataset version 1.0.
The reuse licence applies to Projectory's original analysis, tables and graphics. Underlying government records remain subject to the source provider's terms.
Revision history
- Version 1.0 · — First edition, based on data available on 2 October 2026. Monthly and annual comparisons include the latest updates to earlier periods.
Co-founder and Head of Research
About Alex Lovell
Alex has 12 years of real estate experience in the UAE, helping international investors and family offices make informed property purchases through a data-driven approach.
View Alex Lovell on LinkedIn