2–8 November 2026: Dubai and Abu Dhabi Property Transactions Report
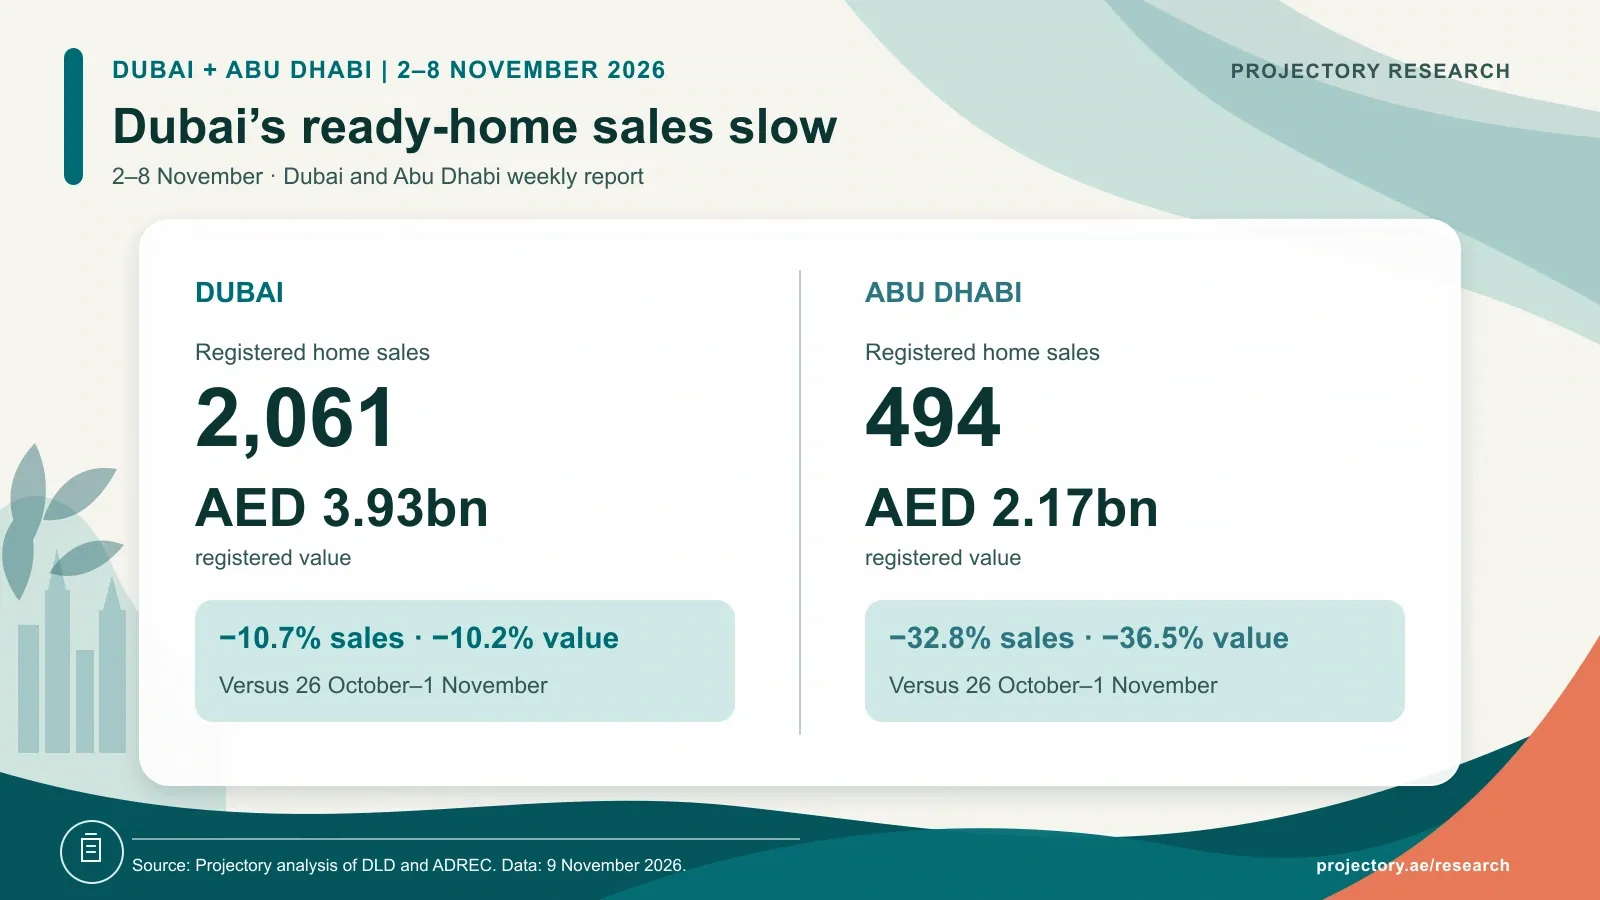
Dubai recorded 2,061 home sales worth AED 3.93bn in 2–8 November; Abu Dhabi recorded 494 worth AED 2.17bn. Explore what drove the weekly changes.
Dubai recorded 2,061 home sales worth AED 3.93bn during 2–8 November 2026, down 10.7% in number and 10.2% in value from the previous week. Ready-home sales accounted for most of the decline, following a cluster of registrations at one Liwan development a week earlier.
Abu Dhabi registered 494 home sales worth AED 2.17bn, down 32.8% in number and 36.5% in value. Here, the slowdown was overwhelmingly in off-plan registrations. Ready-home sales were much steadier, and a handful of higher-value purchases lifted their combined value.
The week at a glance
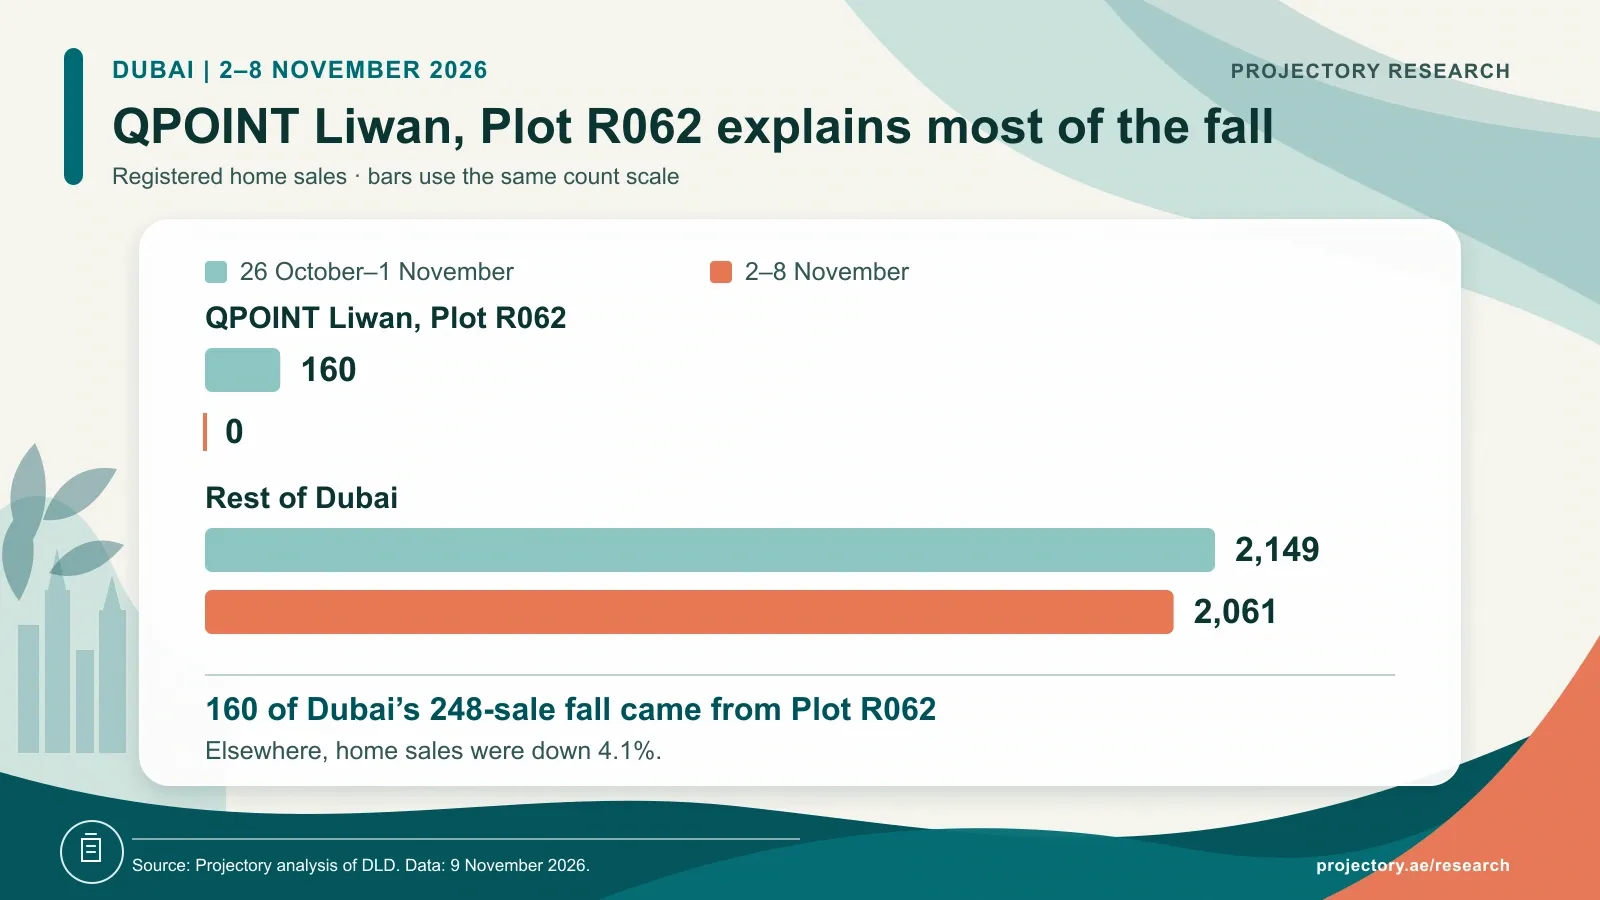
- Dubai’s decline was smaller outside QPOINT Liwan, Plot R062: sales across the rest of the emirate fell 4.1%, compared with the overall 10.7% fall.
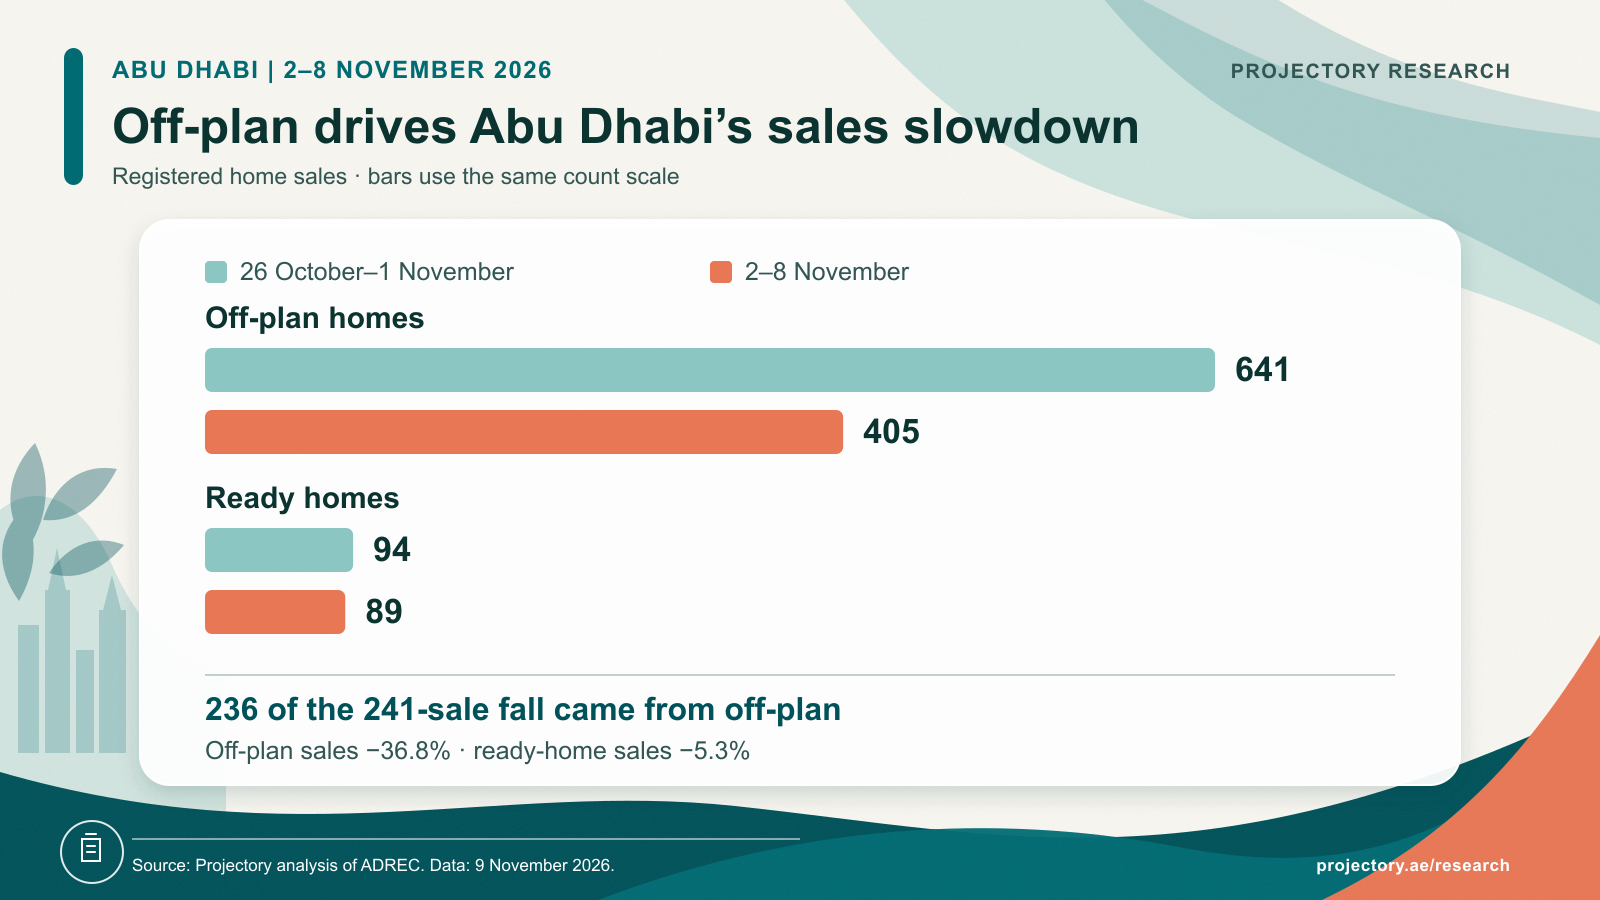
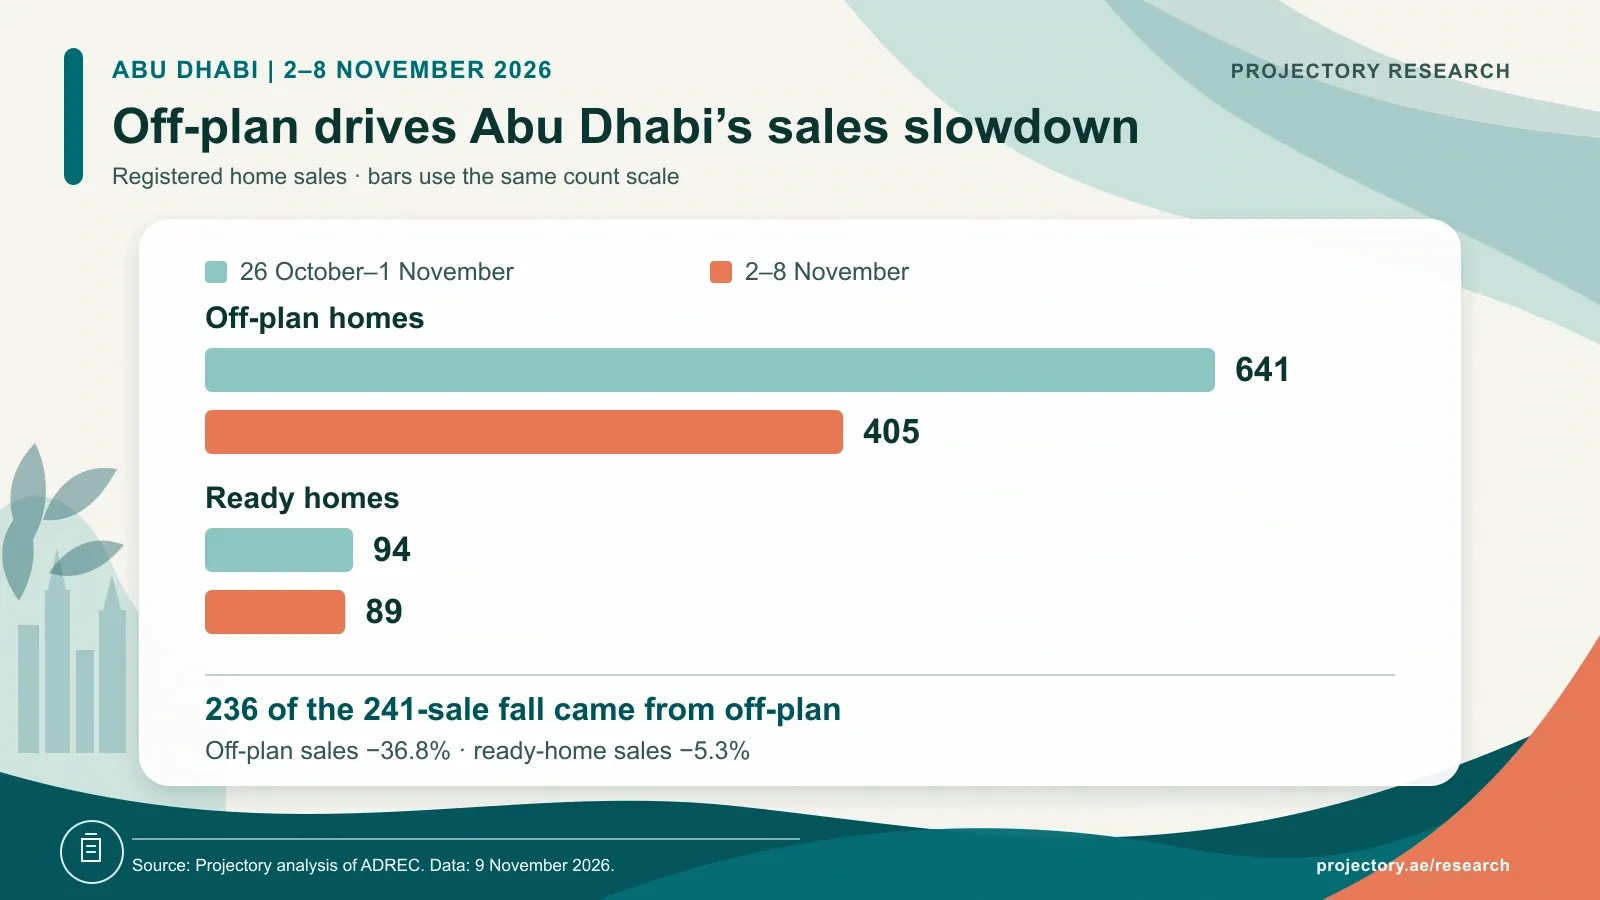
- Off-plan sales accounted for 97.9% of Abu Dhabi’s decline in registrations, falling from 641 to 405.
- Abu Dhabi’s ready-home value rose 32.4% despite fewer sales, helped by ten purchases of AED 5m or more, versus one the week before.
Compares 2–8 November with 26 October–1 November. Data as at 9 November 2026.
Dubai: ready-home sales ease after Liwan’s busy week
Ready-home registrations fell 24.5%, from 911 to 688, while off-plan sales slipped just 1.8%, from 1,398 to 1,373. Off-plan homes consequently represented 66.6% of the week’s sales, up from 60.5%.
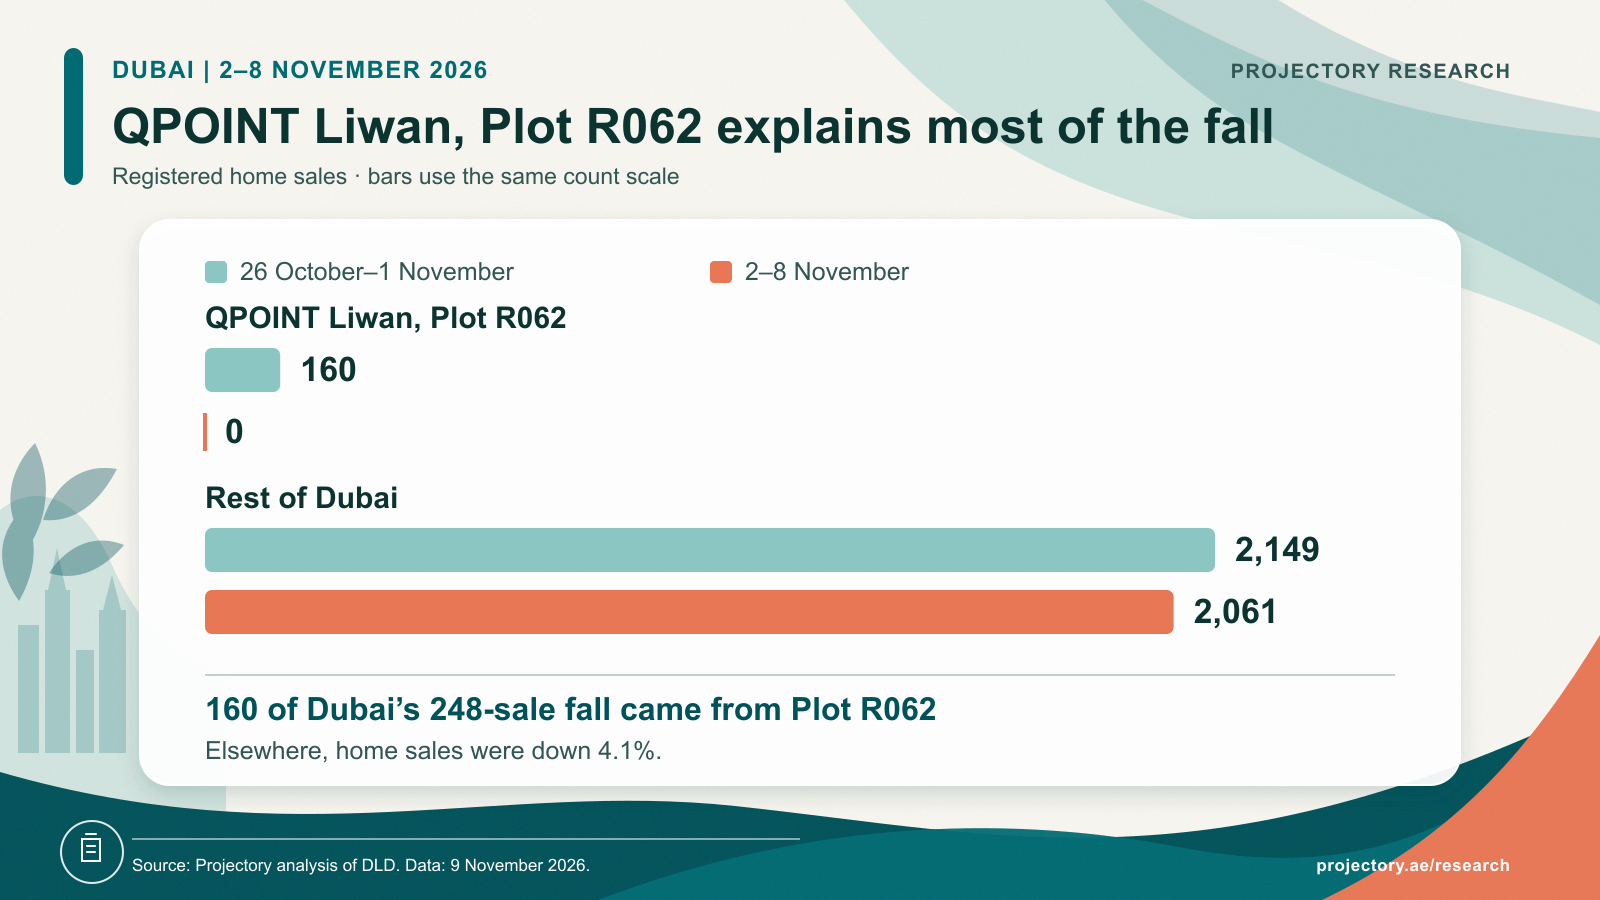
The previous week included 160 ready-apartment registrations at QPOINT Liwan, Plot R062. None appeared in the latest week. This one project accounts for 64.5% of Dubai’s 248 fewer sales. Across the rest of the emirate, registrations fell from 2,149 to 2,061, or 4.1%.
Free to reuse with attribution. Credit and link to the original Projectory Research analysis.
Reuse termsAzizi Venice recorded 128 off-plan sales worth AED 104.6m, more than twice the previous week’s 61. Across Dubai, homes below AED 2m accounted for 1,392 sales, or 67.5% of registrations.
Abu Dhabi: fewer off-plan sales, a dearer mix of ready homes
Off-plan registrations fell 36.8%, from 641 to 405, accounting for 236 of the emirate’s 241 fewer home sales. Ready-home sales fell by just five, from 94 to 89, a decline of 5.3%.
Free to reuse with attribution. Credit and link to the original Projectory Research analysis.
Reuse termsThe ready market’s combined value nevertheless rose from AED 186.6m to AED 247.1m, up 32.4%. Ten sales of AED 5m or more contributed AED 95.99m, compared with one sale worth AED 6.2m a week earlier. The increase reflects a more expensive mix of homes sold; it does not establish that comparable properties rose in price.
Ramhan Island recorded 33 villa sales worth AED 641.5m, all off-plan. Those registrations made up just 6.7% of Abu Dhabi’s home sales but 29.6% of their value.
About the data
This report compares 2–8 November 2026 with 26 October–1 November, using data available on 9 November. Both windows run from Monday to Sunday. The analysis covers registered home sales; plots, whole residential buildings or complexes, and non-sale transactions are excluded. See our research methodology for definitions.
Coverage and calculation notes
The latest source dates are 9 November for Dubai and 6 November for Abu Dhabi. Only registrations within the reporting windows are counted. No Abu Dhabi records dated 7–8 November appear in the available data; this is not independent confirmation of zero activity on those dates.
Abu Dhabi’s comparison now includes two late apartment registrations, bringing the previous week to 735 homes worth AED 3.412bn. Dubai’s comparison is unchanged. Both weeks use the same snapshot and home-sale definitions.
The Abu Dhabi comparison retains 384 Projectory-reviewed villa or townhouse classifications, including 218 estimates based on project information and historical transactions. These are not ADREC-confirmed unit classifications; recorded dates, values and sale status are unchanged. No bedrooms or usable built-up areas have been inferred. Changes in villa and townhouse counts should therefore be interpreted with care. Six current-week records labelled as residential complexes, worth AED 59.75m, remain excluded, as do 15 unresolved or suspected whole-asset records from the comparison week.
DLD downloadable records take precedence where available, with approved source corrections retained; API-only registrations use their API facts. Each sale is counted once. Original area and project labels are retained in the downloadable data, so aliases may appear separately; homes without project names remain in market totals. Price-per-square-foot medians use positive usable areas: 1,870 Dubai homes and 482 Abu Dhabi homes this week, versus 2,050 and 351 respectively. The differing samples are not a like-for-like price index. Later registrations or corrections may revise figures.
Cite this research
Projectory Research, 2–8 November 2026: Dubai and Abu Dhabi Property Transactions Report, 9 November 2026, dataset version 1.0. Link to this report. Include the reporting period and data date when quoting figures.
Download the data
Download the aggregate CSV. Charts include reusable PNGs and source data. Projectory’s original analysis, tables and statistical graphics are available under CC BY 4.0.
Related research
- Previous weekly report: 26 October–1 November
- Dubai’s October report
- Abu Dhabi’s October report
- Browse Dubai transactions and Abu Dhabi transactions.
Sources
Projectory Research data
Download the report aggregates
Weekly home-sale totals, comparisons, off-plan and ready sales, price bands, project and area groupings, registration concentrations, source coverage and comparison revisions.
- Period
- 2026-11-02/2026-11-08
- Versions
- Dataset 1.0 · Method 1.0
- Status
- Initial release
- Coverage
- Dubai and Abu Dhabi, United Arab Emirates
- Data refreshed
- 9 November 2026
The file contains grouped market statistics and no personal details or individual transaction records. Suggested citation: Projectory Research, 2–8 November 2026: Dubai and Abu Dhabi Property Transactions Report, 9 November 2026, dataset version 1.0.
The reuse licence applies to Projectory's original analysis, tables and graphics. Underlying government records remain subject to the source provider's terms.
Revision history
- Version 1.0 · — Initial edition using verified data available on 9 November. Both comparison periods are calculated from the same snapshot; source coverage, classifications and exclusions are documented.
Co-founder and Head of Research
About Alex Lovell
Alex has 12 years of real estate experience in the UAE, helping international investors and family offices make informed property purchases through a data-driven approach.
View Alex Lovell on LinkedIn