26 October–1 November 2026: Dubai and Abu Dhabi Property Transactions Report
Dubai home-sale value rose 15.5% in 26 October–1 November. Abu Dhabi recorded 733 sales worth AED 3.40bn. Read the weekly findings.
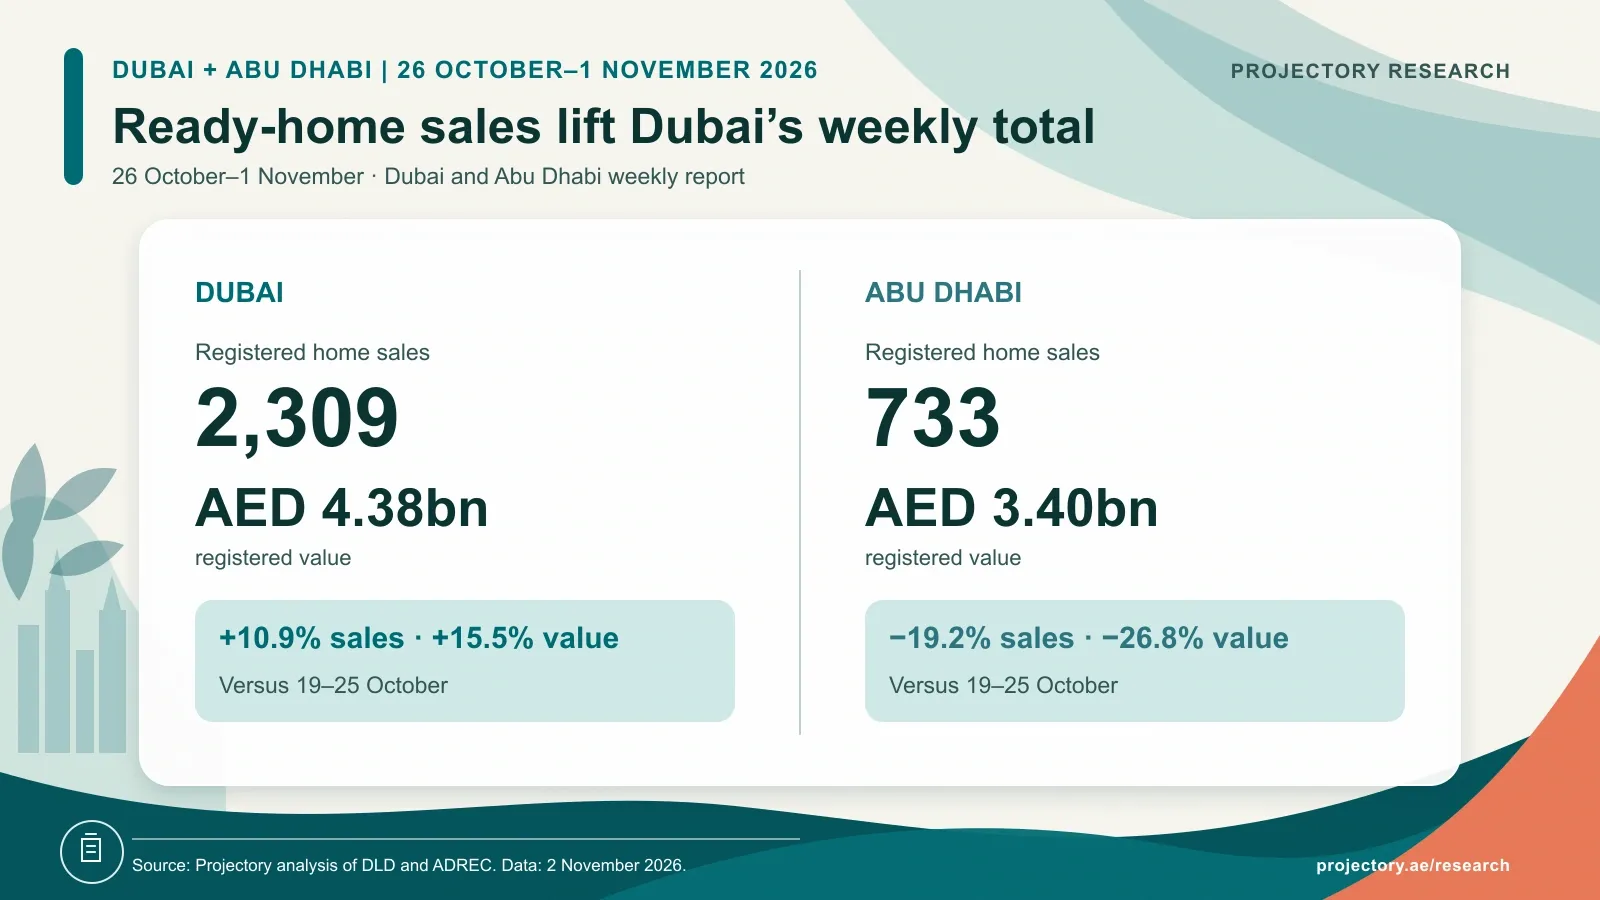
Dubai registered 2,309 home sales worth AED 4.38bn during 26 October–1 November 2026, up 10.9% in number and 15.5% in value from the previous week. Ready homes led the increase, although much of the extra activity came from one development in Liwan.
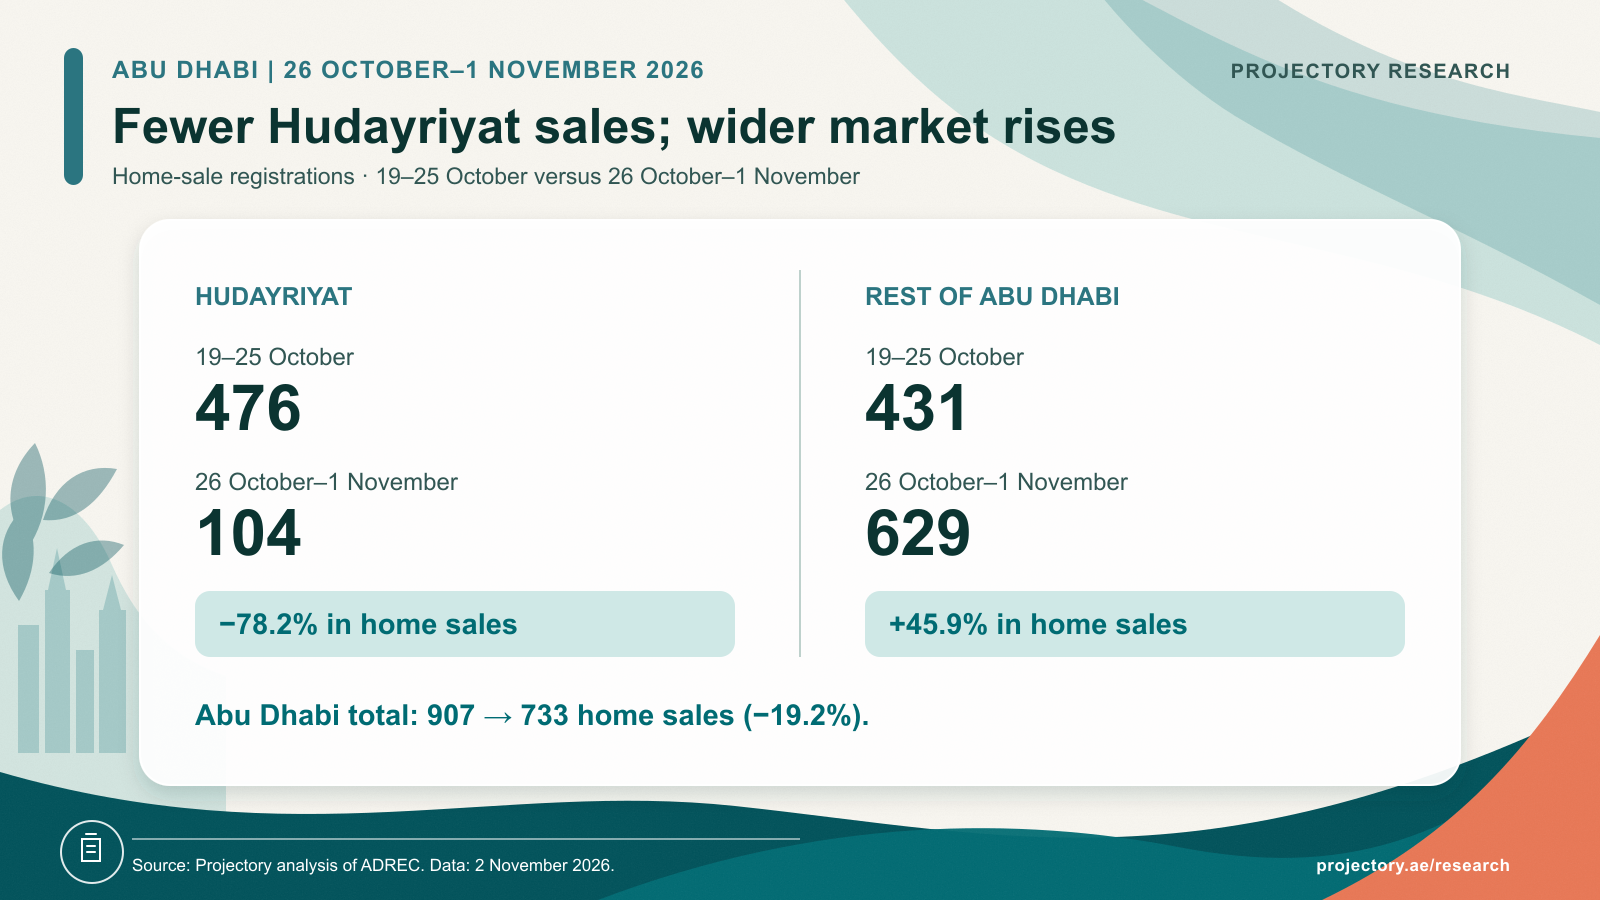
Abu Dhabi recorded 733 home sales worth AED 3.40bn, down 19.2% in number and 26.8% in value. The fall reflected a much quieter week in Hudayriyat; across the rest of the emirate, sales increased.
The week at a glance
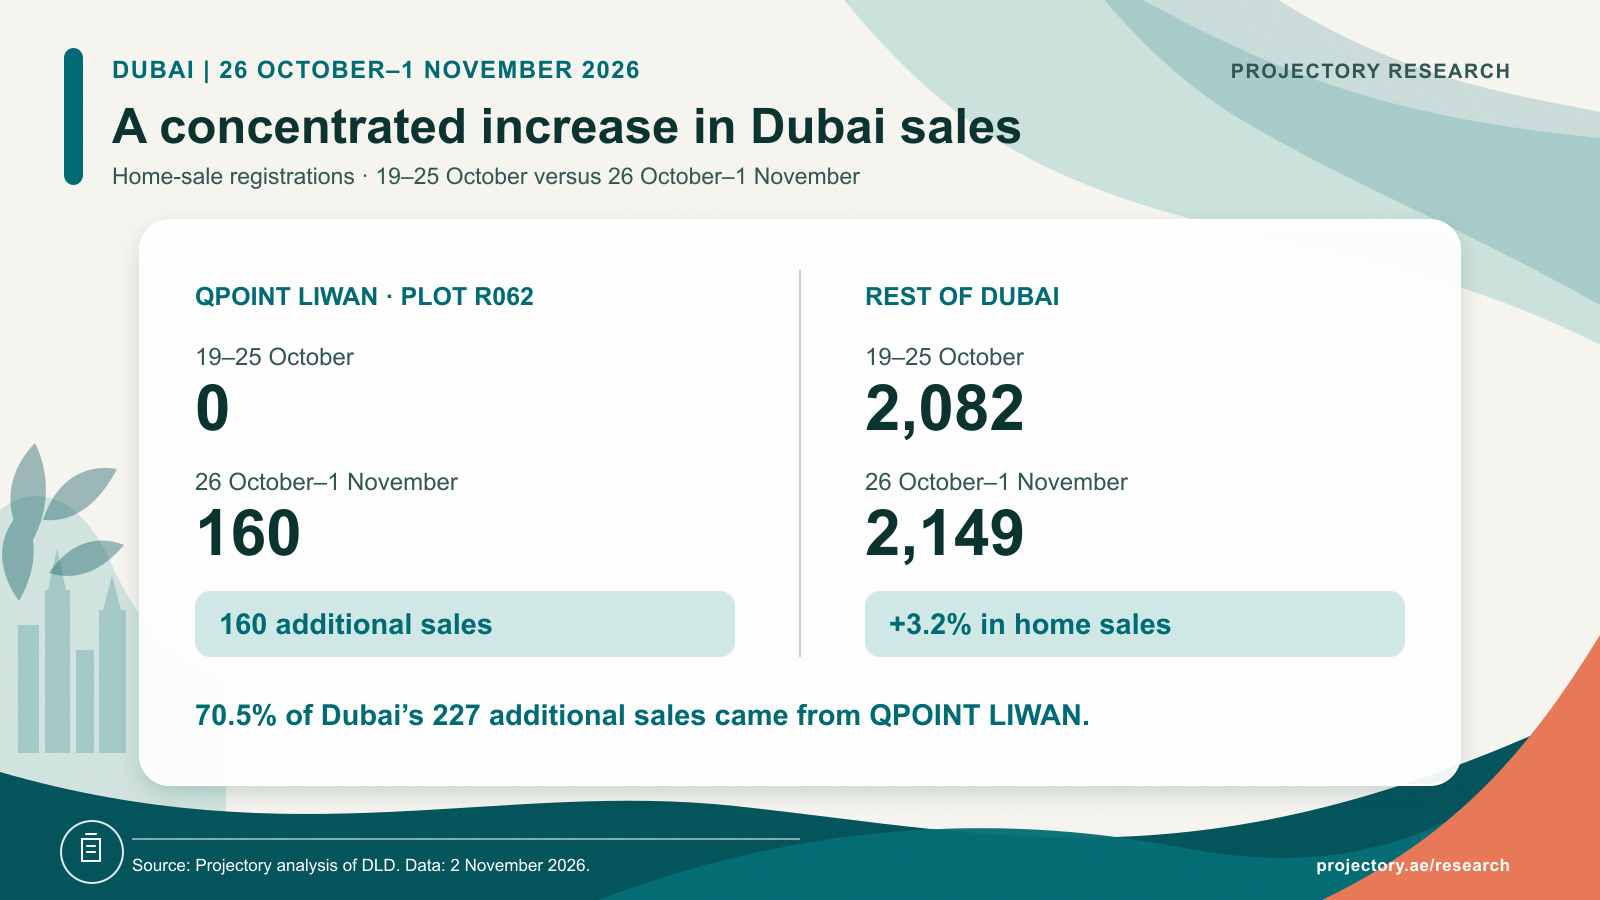
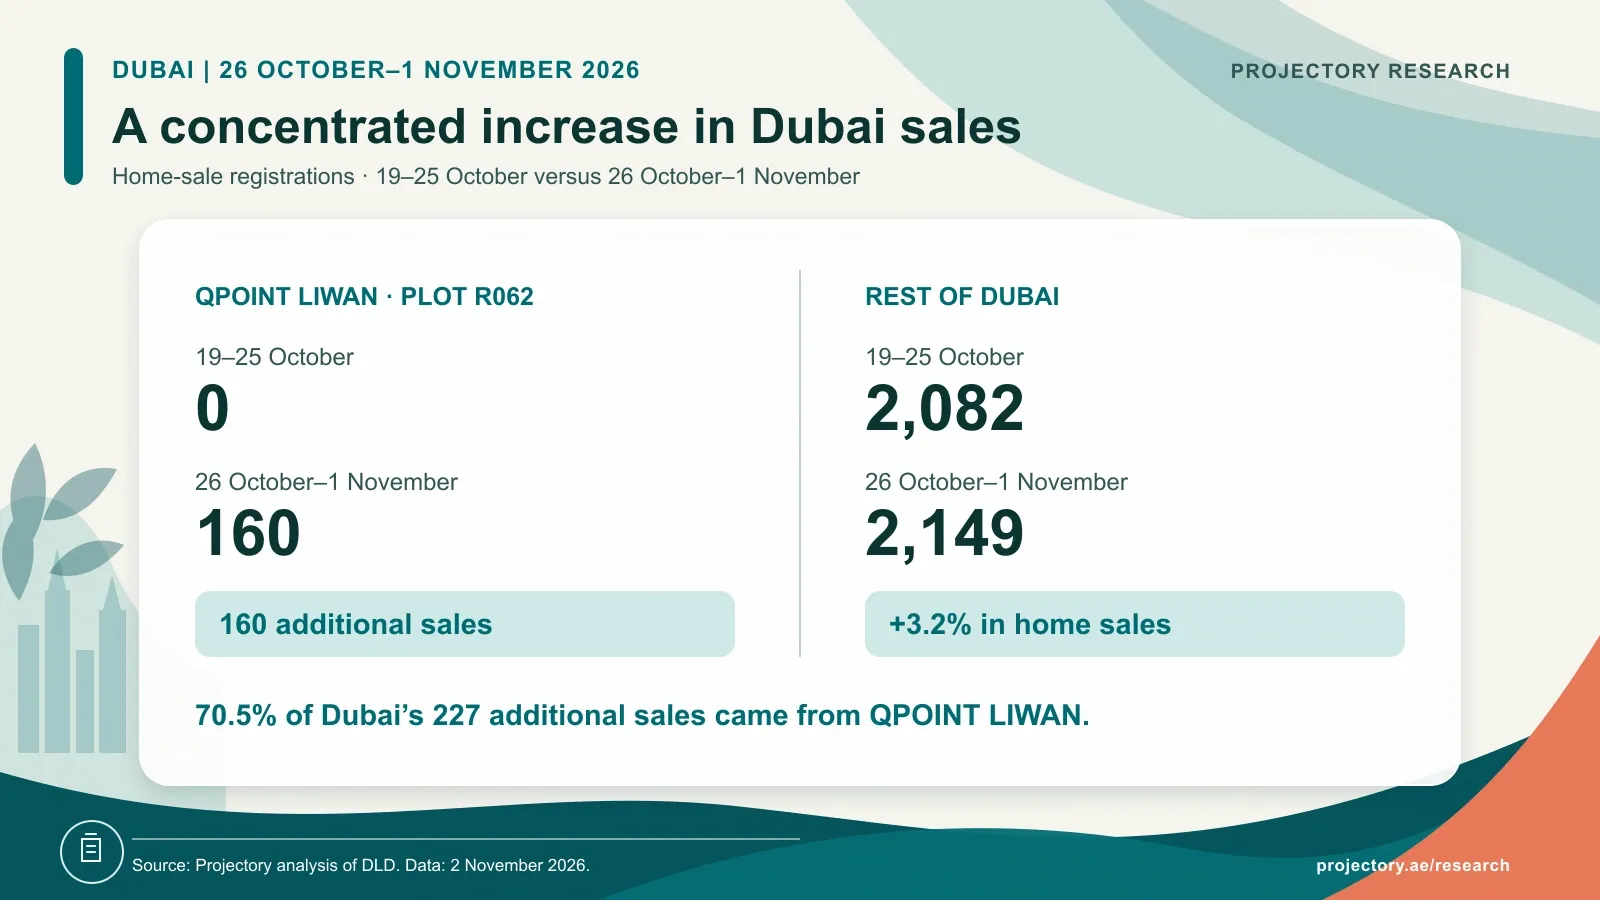
- One Liwan development supplied most of Dubai’s increase: 160 registrations at QPOINT Liwan accounted for 70.5% of the additional sales.
- Dubai’s AED 5m–10m segment gained activity: 103 sales, up from 65, contributed 41.2% of the rise in registered value.
- Abu Dhabi sales outside Hudayriyat rose 45.9%, from 431 to 629, partly offsetting the fall in that area.
Compares 26 October–1 November with 19–25 October. Data as at 2 November 2026; see the methodology for Abu Dhabi’s reviewed classifications.
Dubai: Liwan explains much of the increase
QPOINT Liwan, Plot R062, recorded 160 ready-apartment sales worth AED 170.0m, all registered on 29 and 30 October. It had none in the previous week. Across the rest of Dubai, registrations rose from 2,082 to 2,149, an increase of 3.2%.
The wider market therefore grew more modestly than the headline suggests. These are separate registrations at one development; the records do not establish that they formed a single bulk purchase.
Free to reuse with attribution. Credit and link to the original Projectory Research analysis.
Reuse termsReady-home sales rose 34.8% to 911, while off-plan sales were almost unchanged at 1,398, down 0.6%. Ready homes accounted for 39.5% of all sales, compared with 32.5% a week earlier.
Sales between AED 5m and AED 10m increased from 65 worth AED 427.0m to 103 worth AED 668.9m. Their additional AED 241.9m accounted for 41.2% of the increase in Dubai’s total sales value. At the same time, the largest share of activity remained below AED 2m: 1,582 homes, or 68.5% of registrations.
Jumeirah Village Circle led locations with 239 sales, followed by Liwan with 165. The largest individual home sale was a three-bedroom apartment at The Royal Atlantis Resort and Residences for AED 29m, registered on 29 October.
Abu Dhabi: the decline was concentrated in Hudayriyat
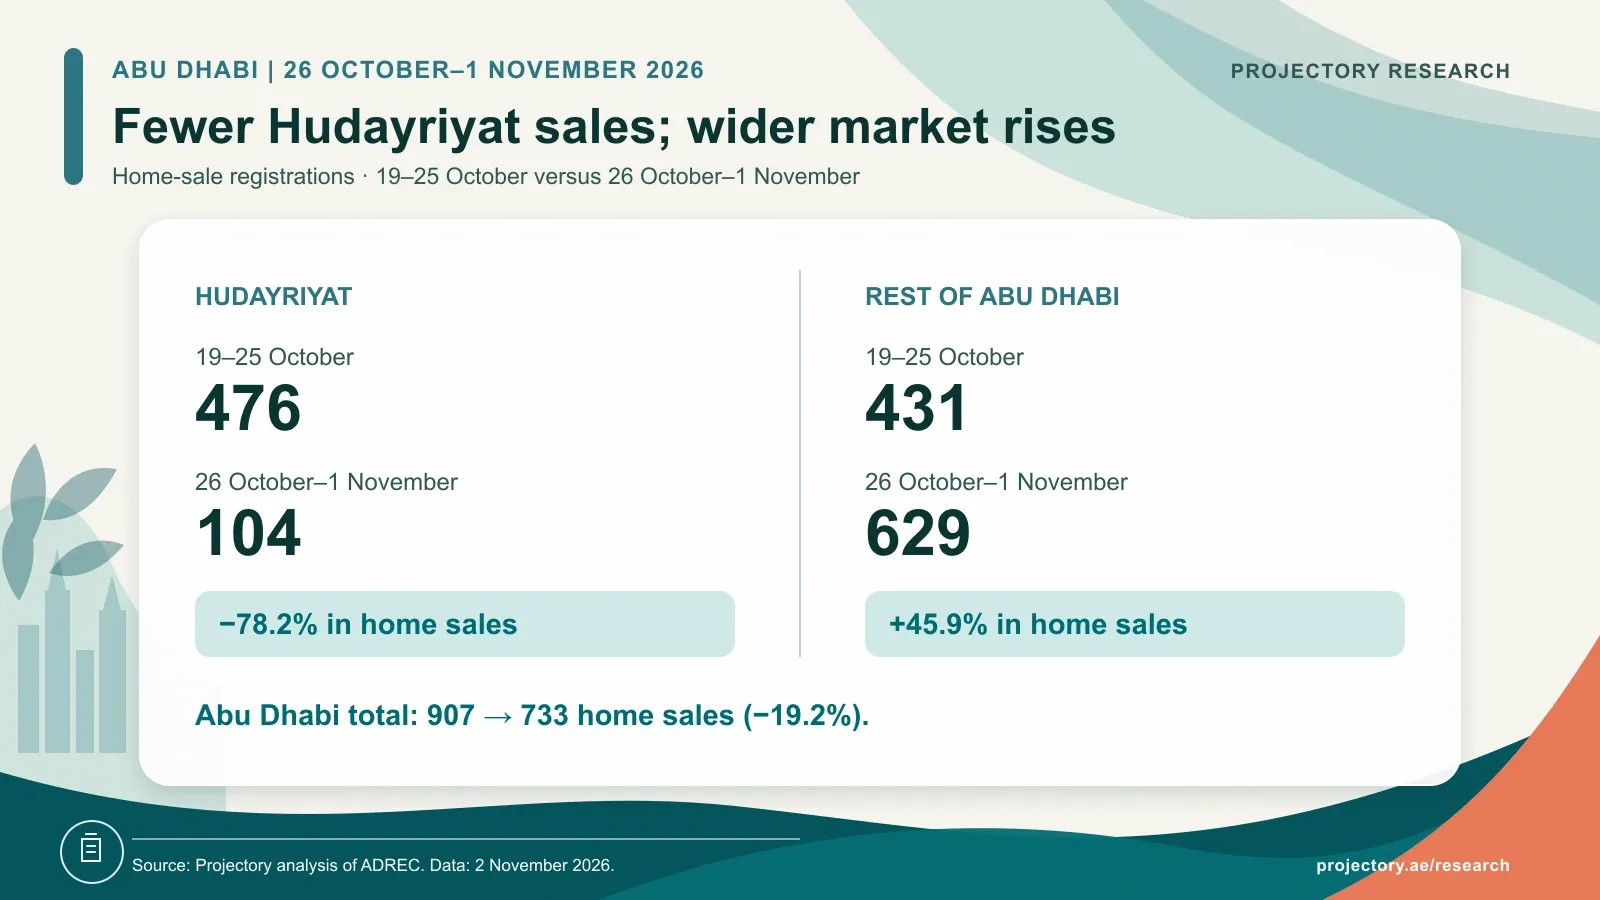
Hudayriyat recorded 104 home sales worth AED 901.2m, compared with 476 worth AED 3.17bn a week earlier. Its 372 fewer registrations more than accounted for the emirate-wide decline of 174; sales elsewhere increased by 198.
Across the rest of Abu Dhabi, registrations rose from 431 to 629, up 45.9%. The overall fall therefore masks an increase in activity outside the area that had dominated the previous week.
Free to reuse with attribution. Credit and link to the original Projectory Research analysis.
Reuse termsAl Layyan led the locations by count with 167 sales, followed by Al Reem Island with 115 and Hudayriyat with 104. Off-plan homes supplied 639 registrations, or 87.2% of the emirate’s home sales; ready homes accounted for 94.
Apartment activity remained close to the previous week, with 337 sales worth AED 789.4m, versus 345 worth AED 763.3m. Their higher combined value despite fewer sales reflects a more expensive mix of apartments changing hands, rather than a measured rise in comparable property prices.
About the data
This report covers 26 October–1 November 2026, compared with 19–25 October, using data available on 2 November. Both reporting windows run from Monday to Sunday. Home totals exclude plots, whole residential buildings or complexes, and non-sale transactions. Abu Dhabi totals include 384 reviewed property classifications, of which 218 are estimates. See our research methodology and the notes below.
Coverage and calculation notes
The latest recorded sale date in the sources is 2 November for Dubai and 30 October for Abu Dhabi. Only registrations within the reporting windows are included. Abu Dhabi’s absence of records for 31 October and 1 November has not been independently confirmed as zero activity.
Projectory reviewed the villa and townhouse labels for 384 registrations dated 26–30 October using project information and historical transactions. Of these, 218 rely on estimated classifications. The original registration dates, sale values and sale status are unchanged; the classifications are not ADREC-confirmed unit identities. Eleven unclear registrations and four suspected whole buildings or compounds remain outside the totals. No bedrooms or built-up areas have been inferred, and the 384 added homes are excluded from price-per-square-foot calculations. Earlier source classifications are retained, so changes in villa and townhouse counts can also reflect differences in labelling.
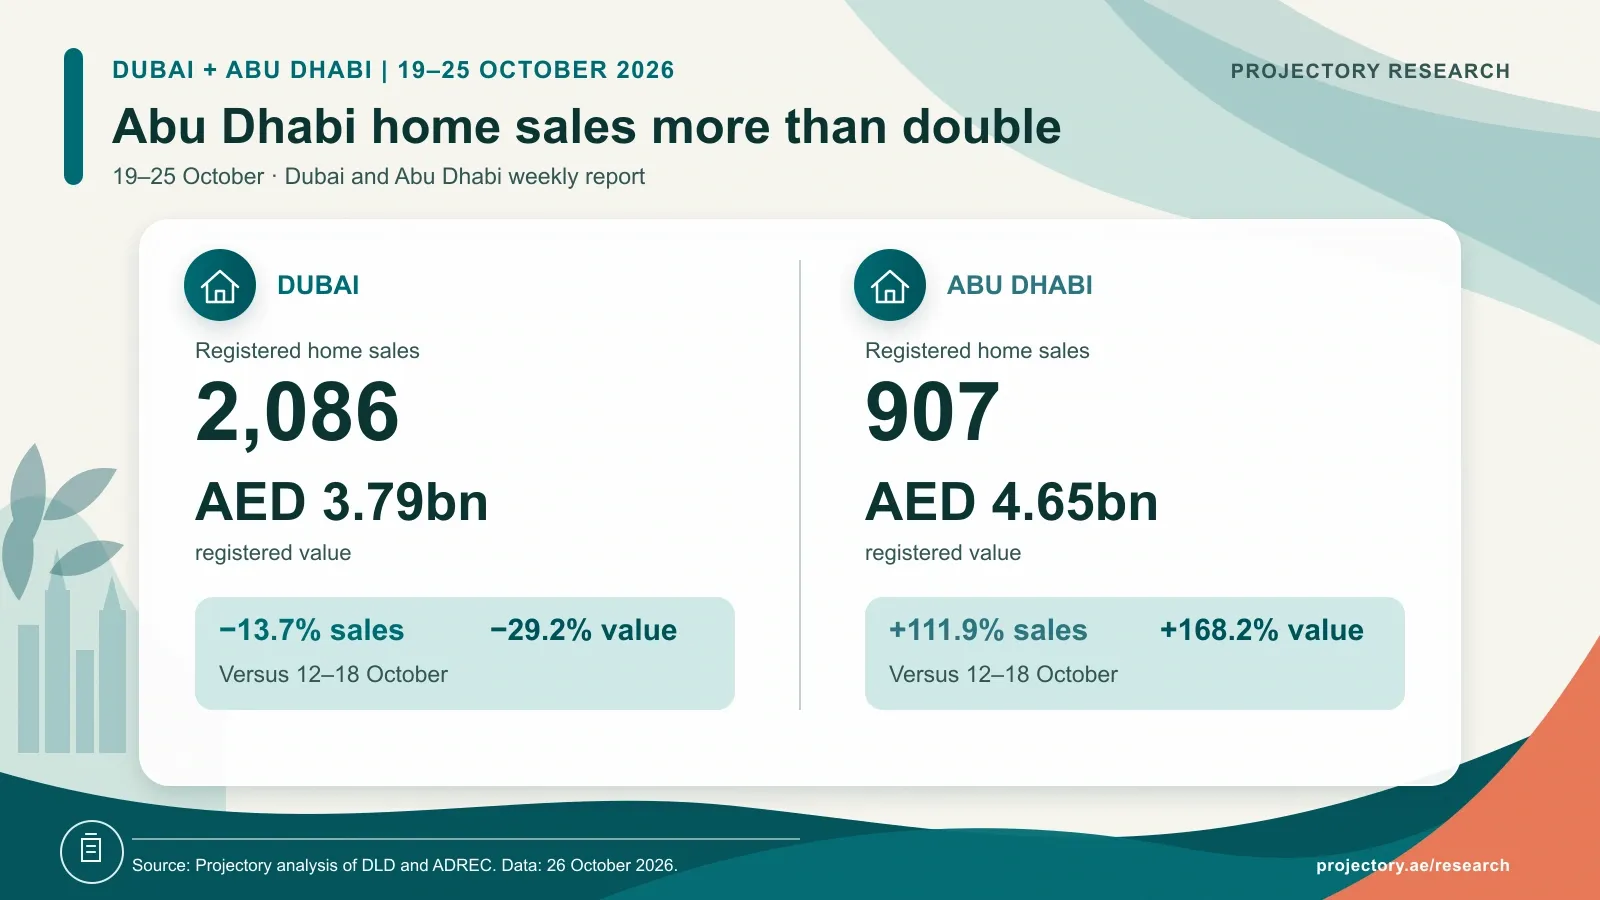
Dubai’s previous week now contains 2,082 homes worth AED 3.788bn, compared with 2,086 worth AED 3.794bn in the original report. Abu Dhabi’s previous-week home total remains 907 worth AED 4.652bn. Comparisons use the same source date and definitions.
DLD downloadable records take precedence where available, with verified source corrections retained; API-only registrations use their recorded API facts. Homes without project names remain included. Price-per-square-foot medians describe the properties sold, not like-for-like price movements. Later registrations and corrections may revise the figures.
Cite this research
Projectory Research, 26 October–1 November 2026: Dubai and Abu Dhabi Property Transactions Report, 2 November 2026, dataset version 1.1. Link to this report. Include the reporting period and data date when quoting figures; retain the classification note when discussing Abu Dhabi property types.
Download the data
Download the aggregate CSV. Charts include reusable PNGs and source data. Projectory’s original analysis, tables and statistical graphics are available under CC BY 4.0.
Related research
- Previous weekly report: 19–25 October
- Dubai’s October report
- Abu Dhabi’s October report
- Browse Dubai transactions and Abu Dhabi transactions.
Sources
Projectory Research data
Download the report aggregates
Weekly home-sale totals and comparisons, off-plan and ready sales, property types, price bands, leading locations, comparison revisions and documented Abu Dhabi classification estimates.
- Period
- 2026-10-26/2026-11-01
- Versions
- Dataset 1.1 · Method 1.0
- Status
- Revised release
- Coverage
- Dubai and Abu Dhabi, United Arab Emirates
- Data refreshed
- 2 November 2026
The file contains grouped market statistics and no personal details or individual transaction records. Suggested citation: Projectory Research, 26 October–1 November 2026: Dubai and Abu Dhabi Property Transactions Report, 2 November 2026, dataset version 1.1.
The reuse licence applies to Projectory's original analysis, tables and graphics. Underlying government records remain subject to the source provider's terms.
Revision history
- Version 1.0 · — Initial edition using data available on 2 November, including the reviewed Abu Dhabi property classifications. Estimates and exclusions are documented in the methodology.
- Version 1.1 · — Corrected the period labels on daily observations.
Co-founder and Head of Research
About Alex Lovell
Alex has 12 years of real estate experience in the UAE, helping international investors and family offices make informed property purchases through a data-driven approach.
View Alex Lovell on LinkedIn