9–15 November 2026: Dubai and Abu Dhabi Property Transactions Report
Dubai home sales reached AED 4.12bn in 9–15 November; Abu Dhabi recorded AED 1.65bn. Explore how higher-value purchases shaped both markets.
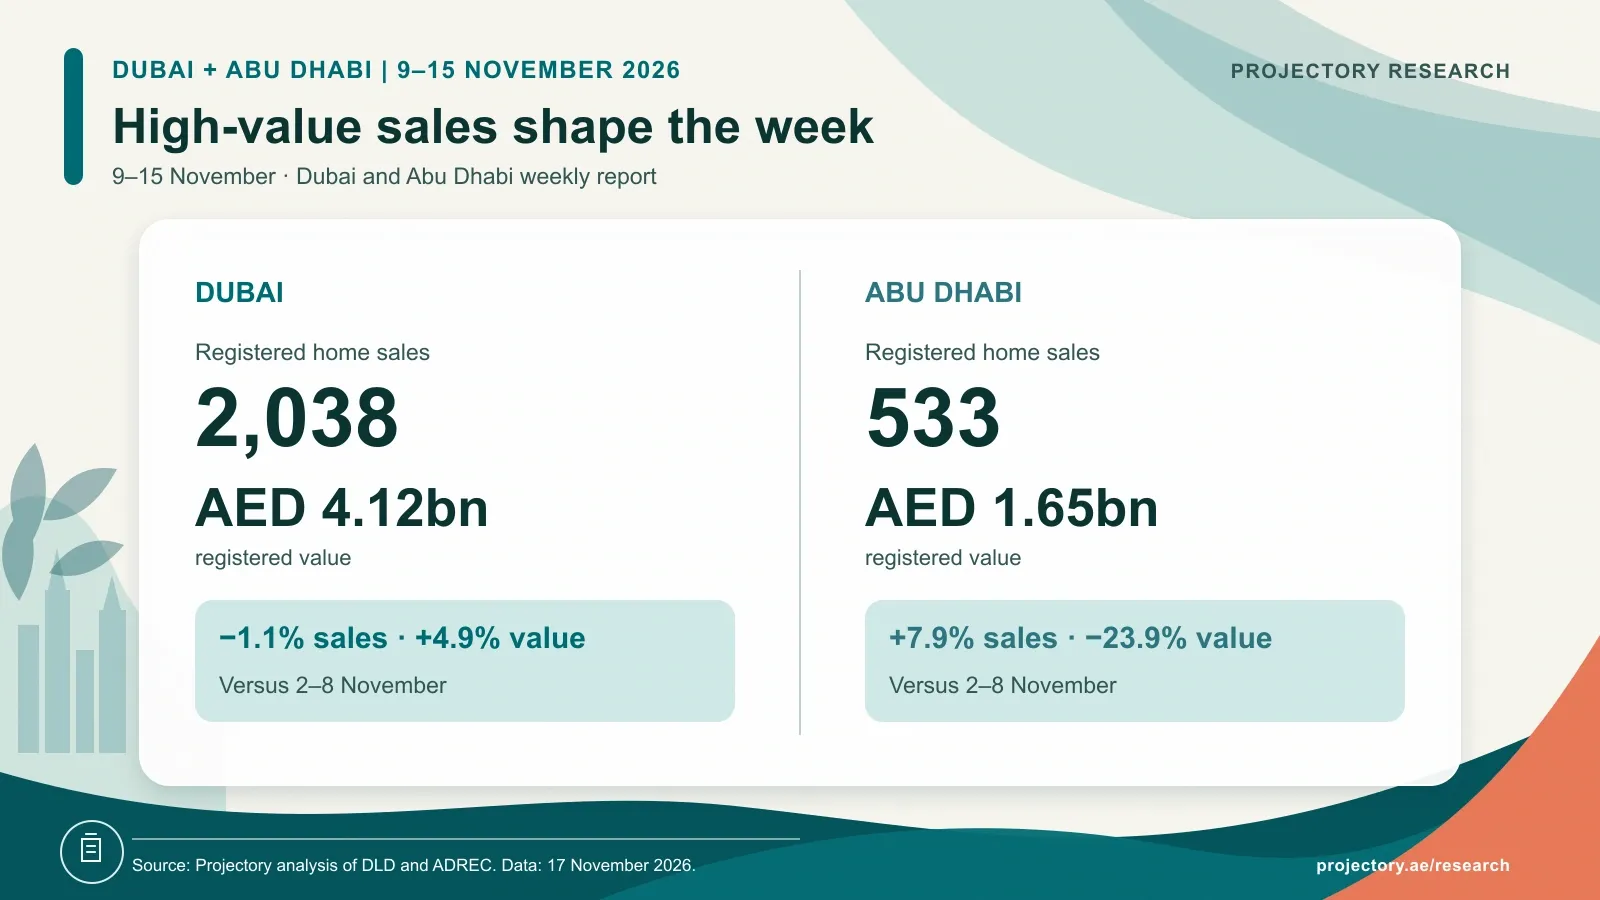
Dubai recorded 2,038 home sales worth AED 4.12bn during 9–15 November 2026. The number of sales edged down 1.1%, but their combined value rose 4.9%, helped by more purchases of AED 10m or above.
Abu Dhabi moved in the opposite direction: 533 homes changed hands, up 7.9%, for AED 1.65bn, down 23.9%. Sales below AED 10m increased, while fewer high-value registrations pulled down the emirate’s total.
The week at a glance
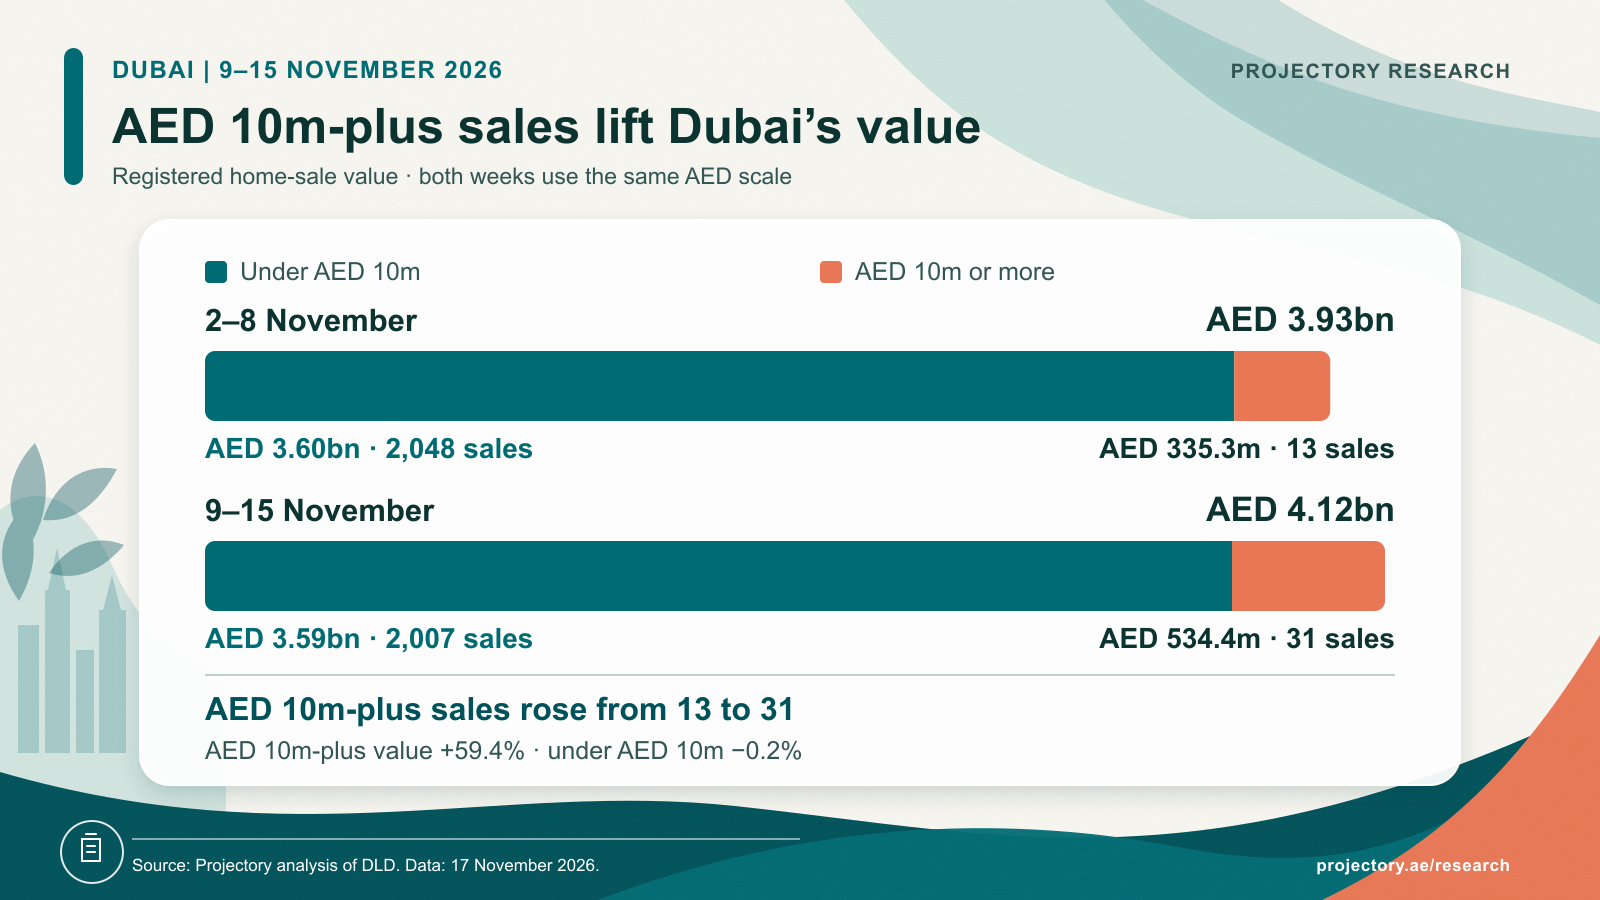
- Dubai’s AED 10m-plus sales more than doubled, from 13 to 31, accounting for the increase in total registered value.
- Abu Dhabi’s busiest price bracket was AED 2m–5m, with 290 sales, up from 191. It represented 54.4% of all home sales.
- Off-plan resales gained ground in Abu Dhabi, rising from 37 to 89, even as initial off-plan sales fell from 368 to 349.
Compares 9–15 November with 2–8 November. Both periods run Monday to Sunday. Data as at 17 November 2026.
Dubai: higher-value purchases lift the weekly total
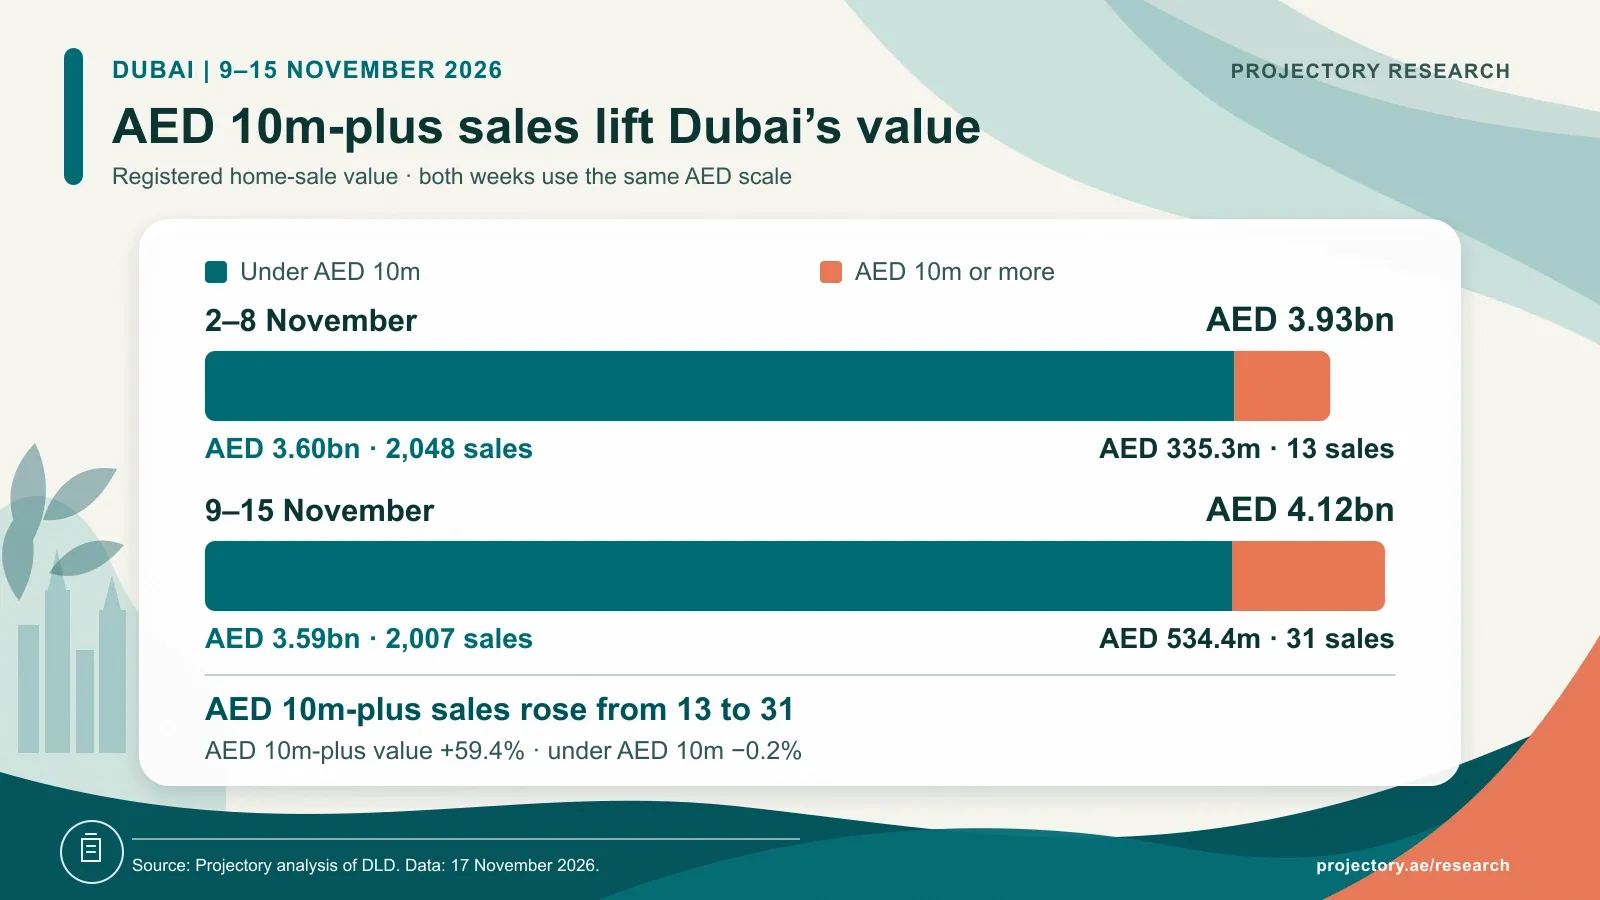
The 31 sales of AED 10m or more were worth AED 534.4m, compared with 13 worth AED 335.3m the previous week. Their value rose by AED 199.1m, slightly more than the AED 191.2m increase across Dubai as a whole.
Below AED 10m, sales slipped from 2,048 to 2,007, and their combined value was almost unchanged at AED 3.59bn, down 0.2%. The higher headline value therefore reflects a greater contribution from expensive homes; it is not evidence of a market-wide rise in prices.
Free to reuse with attribution. Credit and link to the original Projectory Research analysis.
Reuse termsReady-home sales increased from 688 to 717, while off-plan registrations fell from 1,373 to 1,321. Off-plan homes still accounted for 64.8% of sales. Lunaya led the named projects with 110 registrations worth AED 377.9m, all off-plan.
Abu Dhabi: more sales below AED 10m
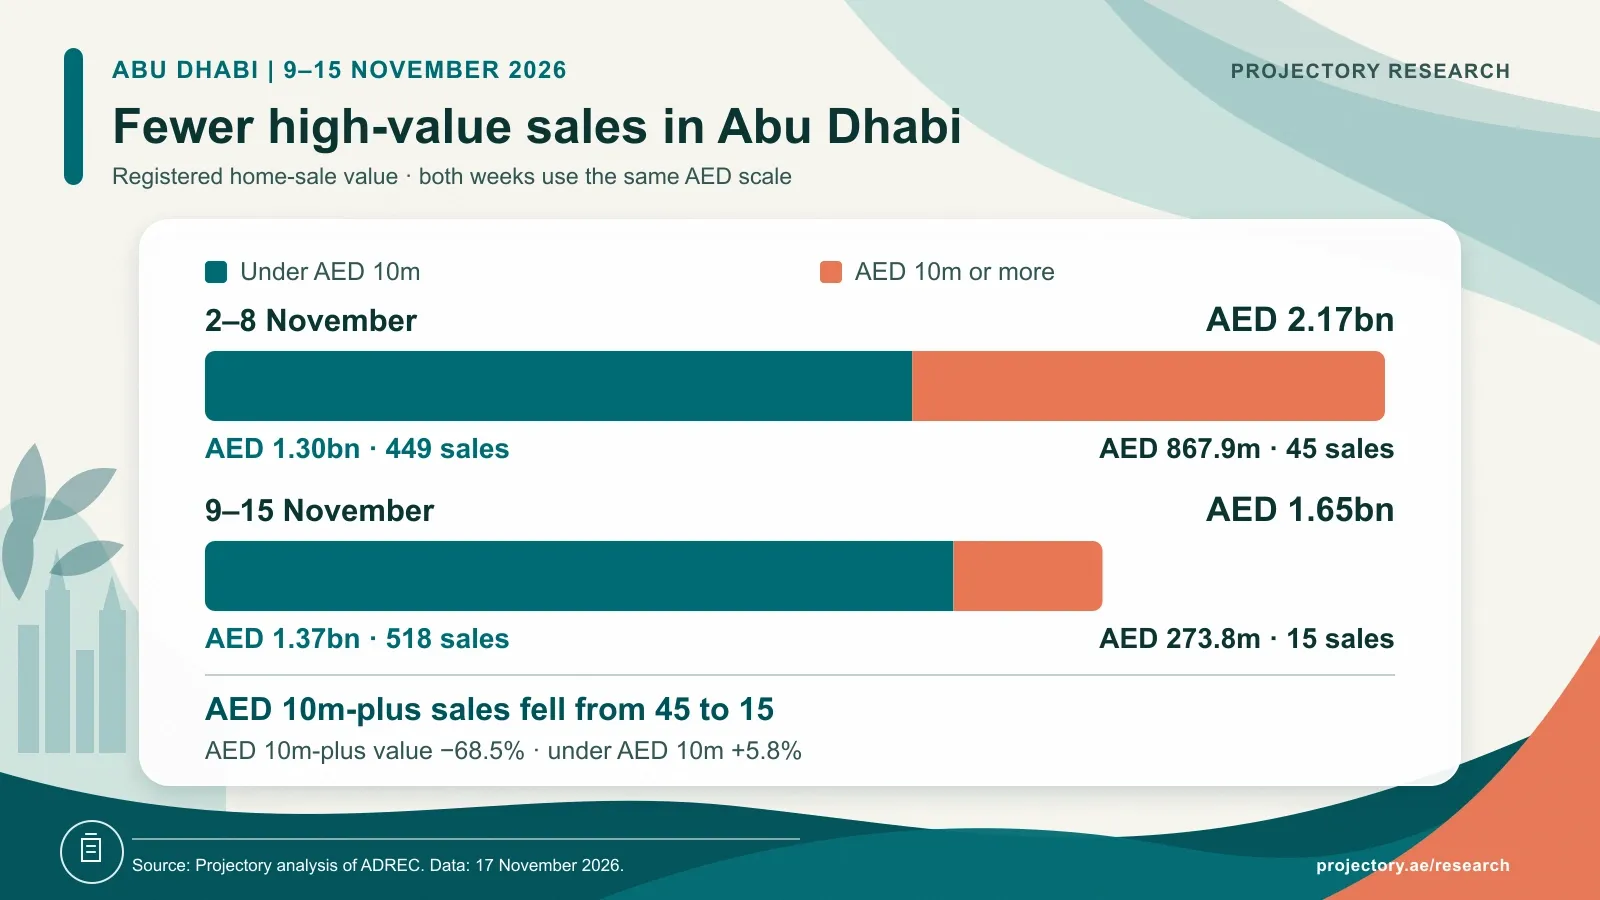
Abu Dhabi registered 518 sales below AED 10m, up 15.4% from 449. Their total value rose 5.8% to AED 1.37bn. Sales of AED 10m or above, however, fell from 45 to 15, with value declining from AED 867.9m to AED 273.8m.
Ramhan Island accounted for much of that shift. Across its phases, registrations fell from 33 homes worth AED 641.5m to two worth AED 37.3m. The AED 604.2m reduction exceeded the emirate’s overall AED 518.5m decline, as gains elsewhere provided a partial offset.
Free to reuse with attribution. Credit and link to the original Projectory Research analysis.
Reuse termsOff-plan resales supplied all the net growth in off-plan activity: 89 resales, up from 37, more than offset the reduction in initial sales. Total off-plan registrations rose from 405 to 438; ready-home sales increased from 89 to 95. The week combined wider activity in lower price brackets with fewer large purchases, rather than a uniform slowdown across the market.
About the data
This report compares 9–15 November 2026 with 2–8 November, using data available on 17 November. It covers registered home sales; plots, whole residential buildings or complexes, and non-sale transactions are excluded. See our research methodology for definitions.
Coverage and calculation notes
Source coverage extends to 17 November in Dubai and 16 November in Abu Dhabi. Only registrations inside the two reporting windows are counted. Both comparison-week home totals are unchanged from the previous report.
Six Abu Dhabi records worth AED 185.73m remain outside this week’s totals because their residential-complex classifications do not establish individual home sales. Six records worth AED 59.75m are excluded on the same basis from the comparison week. Twelve current-week villa or townhouse classifications use project-name information; these assignments do not change the total number or value of homes. Two Dubai records dated 12 November, worth AED 62.33m, are excluded pending resolution of inconsistent dates and registration identifiers.
DLD downloadable records take precedence where available, with approved source corrections retained; API-only registrations use their API facts. Each sale is counted once. The aggregate CSV retains original project and area labels, so aliases can appear separately; unnamed projects remain in market totals. Price-per-square-foot medians use 1,863 Dubai homes and 527 Abu Dhabi homes with positive usable areas this week, versus 1,870 and 482 respectively. Medians describe the homes sold and are not a like-for-like price index. Later registrations and corrections may revise figures.
Cite this research
Projectory Research, 9–15 November 2026: Dubai and Abu Dhabi Property Transactions Report, 17 November 2026, dataset version 1.0. Link to this report. Include the reporting period and data date when quoting figures.
Download the data
Download the aggregate CSV. Charts include reusable PNGs and source data. Projectory’s original analysis, tables and statistical graphics are available under CC BY 4.0.
Related research
- Previous weekly report: 2–8 November
- Dubai’s October report
- Abu Dhabi’s October report
- Browse Dubai transactions and Abu Dhabi transactions.
Sources
Projectory Research data
Download the report aggregates
Weekly home-sale totals, comparisons, off-plan and ready sales, price bands, project and area groupings, higher-value sales, source coverage and exclusions.
- Period
- 2026-11-09/2026-11-15
- Versions
- Dataset 1.0 · Method 1.0
- Status
- Initial release
- Coverage
- Dubai and Abu Dhabi, United Arab Emirates
- Data refreshed
- 17 November 2026
The file contains grouped market statistics and no personal details or individual transaction records. Suggested citation: Projectory Research, 9–15 November 2026: Dubai and Abu Dhabi Property Transactions Report, 17 November 2026, dataset version 1.0.
The reuse licence applies to Projectory's original analysis, tables and graphics. Underlying government records remain subject to the source provider's terms.
Revision history
- Version 1.0 · — Initial edition using verified data available on 17 November. Both comparison periods are calculated from the same snapshot; source coverage, classifications and exclusions are documented.
Co-founder and Head of Research
About Alex Lovell
Alex has 12 years of real estate experience in the UAE, helping international investors and family offices make informed property purchases through a data-driven approach.
View Alex Lovell on LinkedIn